Overview
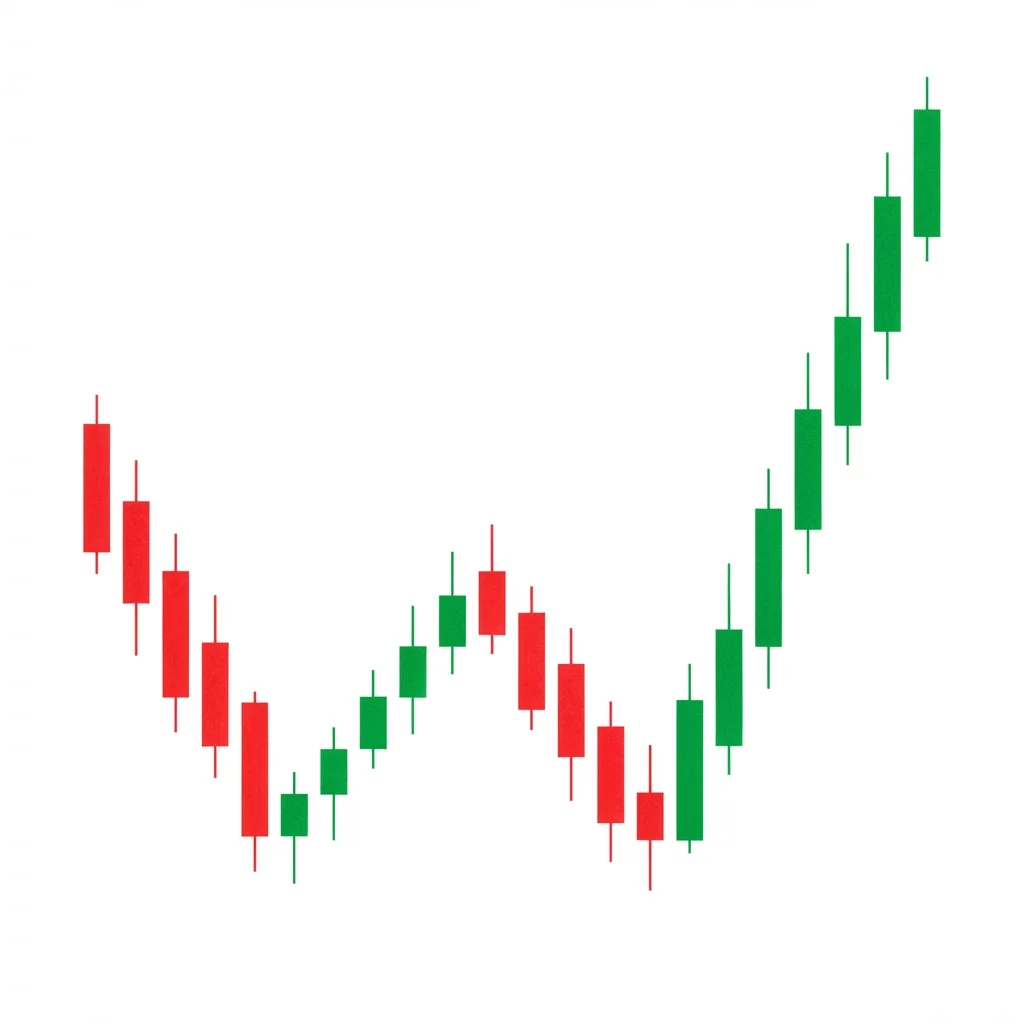
Bullish Double Bottom
Also known as: W-Bottom, Twin Bottom, Double Low
The Double Bottom is one of the most recognized reversal patterns, forming a W-shape where price tests a support level twice and bounces, signaling that sellers cannot push through and buyers are gaining control.
The Double Bottom forms when price declines to a support level, bounces to create a middle peak (neckline), then returns to test the same support level a second time. When price cannot break below the first low on the second attempt, it signals that demand at that level exceeds supply. The pattern is confirmed when price breaks above the neckline (the middle peak between the two lows). The measured move target is the height from the troughs to the neckline, projected above the neckline. The Double Bottom is powerful because it represents a definitive failure of sellers to establish a new lower low, which is the core requirement for a downtrend to continue.
History & Etymology
The Double Bottom is one of the oldest recognized chart patterns, documented by Charles Dow in the early 1900s and extensively analyzed by Edwards and Magee. It remains one of the most studied patterns, with Thomas Bulkowski finding it among the most reliable reversal patterns in his comprehensive statistical research.
The name describes exactly what it looks like: two bottoms (troughs) at approximately the same price level. The W-Bottom nickname comes from the W shape formed by the two troughs and the middle peak.
How It Forms
Formation Steps
- 1First trough: price makes a low after a downtrend
- 2Rally to a middle peak (the neckline level)
- 3Second trough: price declines to approximately the same level as the first trough
- 4Rally from second trough back through the neckline to confirm the pattern
Prerequisites
- Prior downtrend of significance
- Two troughs at approximately the same price level (within 3-4%)
- A middle peak creating the neckline resistance
Confirmation Signals
- Price closes above the neckline (middle peak)
- Volume increases on the breakout above the neckline
- RSI showing bullish divergence between the two bottoms
Invalidation Signals
- Price breaks below both troughs
- Volume increases on the second decline
- No divergence on oscillators between the two lows
Candle Breakdown
First Bottom
Price reaches a significant low, marking the first trough of the W pattern.
Sellers push price to a new low. Buyers step in to defend this level, creating the first bottom.
Middle Rally
Price bounces from the first bottom to create the neckline peak.
Buyers drive a recovery rally, but it stalls at a resistance level, creating the neckline.
Second Bottom and Breakout
Price retests the first bottom level, holds, and then breaks above the neckline.
The second test confirms the support. Sellers failed twice. The breakout above the neckline triggers short covering and new buying.
Psychology
The Double Bottom represents a definitive support test. The first bottom establishes the support level, and the second bottom proves it. When sellers cannot push through on the second attempt, the market accepts that a floor exists.
Buyer Perspective
Buyers who bought the first bottom are validated when price holds on the retest. New buyers enter on the second bottom with more confidence. The neckline breakout attracts momentum buyers.
Seller Perspective
Sellers failed twice at the same level. The second failure is particularly demoralizing and triggers covering. The neckline breakout forces remaining shorts to exit.
Smart Money Action
Institutions often accumulate heavily at both bottoms, knowing that double-tested support is robust. They add aggressively on the neckline breakout.
Retail Trader Trap
Retail traders often sell in panic at the second bottom, thinking the first bottom will break. They then chase the neckline breakout at worse prices.
Emotional Cycle
Trading Strategy
Aggressive Entry
Enter long at the second bottom when price shows a reversal candle at the first bottom level, with a stop below both bottoms.
Conservative Entry
Wait for a close above the neckline (middle peak) with above-average volume.
Measured move: neckline height (from bottoms to neckline) projected above the neckline.
1.618x the pattern height above the neckline.
Prior major resistance from the downtrend.
Best Conditions
- Timeframe: 4h
- Timeframe: daily
- Timeframe: weekly
- After extended downtrends
- At historical support zones
- When the broader market is stabilizing
- Asset: stocks
- Asset: ETFs
- Asset: forex
- Asset: crypto
- Asset: futures
Avoid When
- Timeframe: 1m
- Timeframe: 5m
- In cascading bear markets
- When fundamental conditions continue to deteriorate
Confluence Factors
- Both bottoms at a key Fibonacci level
- RSI divergence (higher RSI at second bottom)
- Volume declining on the second decline
- Both bottoms at a major moving average
- MACD divergence
Scale In Strategy
Enter 50% at the second bottom reversal, add 50% on the neckline breakout.
Scale Out Strategy
Take 33% at the measured move, 33% at 1.618x, trail the rest.
Risk Management
Volume Analysis
Volume Confirmation
Volume should be higher on the first bottom than the second (showing declining selling pressure). Volume should spike on the neckline breakout.
Volume Profile
Decreasing volume on the second decline relative to the first is one of the strongest confirmation signals.
Volume Divergence
If volume is higher on the second decline, sellers may be pressing harder, and the pattern could fail.
Technical Confluence
Support Resistance
The double bottom price level becomes extremely strong support. The neckline transitions from resistance to support after the breakout.
Fibonacci Levels
The second bottom often terminates at a Fibonacci level of the rally from the first bottom to the neckline. The 61.8% or 78.6% is common.
Moving Averages
Double bottoms at the 200 SMA or 50 SMA are particularly reliable.
Rsi Confirmation
RSI showing a higher low at the second bottom (bullish divergence) while price makes an equal low is one of the most reliable confirmations.
Macd Confirmation
MACD making a higher low at the second bottom confirms momentum divergence.
Bollinger Bands
The second bottom often touches or pierces the lower Bollinger Band with recovery, confirming oversold conditions.
Vwap
Anchored VWAP from the first bottom often provides support near the second bottom.
Ichimoku Cloud
The second bottom bouncing off a key Ichimoku level (Kijun-sen) adds confluence.
Elliott Wave
The double bottom may form as the end of Wave 2 or Wave C in corrective patterns.
Wyckoff Phase
The two bottoms can represent the Selling Climax and Secondary Test in Wyckoff accumulation.
Market Profile
The two bottoms create a strong rejection area visible as a double-tested low-volume node.
Order Flow
Aggressive buying at the second bottom with positive delta confirms institutional demand.
Open Interest
Rising open interest at the second bottom confirms new long positions being established.
Multi-Timeframe Analysis
Higher Timeframe Alignment
A daily double bottom at weekly support creates the highest conviction setup.
Lower Timeframe Entry
Use the 4-hour chart to time entries at the second bottom and on the neckline breakout.
Timeframe Confluence
A weekly double bottom at a monthly support level signals a major trend change.
Top-Down Approach
Monthly support, weekly identifies the double bottom, daily times the entry at the second bottom or neckline breakout.
Statistics
Historical Examples
S&P 500 Double Bottom 2022-2023
successThe S&P 500 formed a textbook double bottom in 2022, with the first low in June at 3636 and the second low in October at 3491 (within 4%). The neckline breakout above 4100 in January 2023 launched a sustained rally above 4500.
Lesson: Double bottoms on major indices often precede significant trend changes. RSI divergence between the two lows was clearly visible and provided early confirmation.
Variations
Adam and Eve Double Bottom
First bottom is V-shaped (Adam) and second is rounded (Eve).
Ascending Double Bottom
The second bottom is higher than the first, showing improving demand.
Confusion Matrix
Patterns commonly confused with Bullish Double Bottom and how to distinguish them.
Bullish Cup And Handle
5500% similarLook at the bottom shape. If rounded and smooth, it is a cup. If there are two distinct V-shaped lows with a clear middle peak, it is a double bottom.
Key Differences
- Cup has a smooth rounded bottom; double bottom has a W with distinct lows
- Cup requires a handle; double bottom does not
Bullish Triple Bottom
8000% similarSimply count the number of bottoms at the support level. Two = double bottom, three = triple bottom.
Key Differences
- Triple bottom has three lows; double bottom has two
- Triple bottom base is more extended
The Double Top is an M-shaped reversal pattern where price tests a resistance level twice and fails, creating two peaks at similar levels. The breakdown below the neckline (trough between peaks) confirms the reversal with a measured move target equal to the pattern height.
The Double Bottom Breakout focuses specifically on the confirmed neckline break of a double bottom pattern, which is the highest-conviction entry point with a clear measured move target and defined risk.
The Triple Bottom is a major reversal pattern featuring three distinct lows at approximately the same price level, separated by two intermediate peaks. The breakout above the neckline confirms the reversal and targets a measured move equal to the pattern height.
The Broadening Top (Megaphone) is a chart formation characterized by expanding price swings that create higher highs and lower lows, reflecting increasing volatility and instability at market tops before a bearish breakdown.
The Descending Channel is a chart formation where price trends lower within two parallel downward-sloping trendlines, making consistent lower highs and lower lows in an orderly bearish progression.
The Descending Triangle is a bearish continuation pattern featuring a flat support level with lower highs converging into an apex, typically resolving with a breakdown below the horizontal support as sellers gradually overwhelm buyers.
Pro Tips & Common Mistakes
Pro Tips
- The two bottoms do not need to be at the exact same price. Within 3-4% is acceptable
- RSI divergence between the two bottoms is one of the most reliable confirmation signals
- Lower volume on the second decline is essential and shows selling exhaustion
- The neckline breakout on high volume is the classic entry point, but buying at the second bottom offers much better risk-reward
- A neckline retest after the breakout provides a second-chance entry with the pattern confirmed
Common Mistakes
- Buying at the first bottom without knowing a double bottom is forming
- Not waiting for the neckline breakout for conservative entries
- Ignoring volume patterns between the two bottoms
- Setting the measured move incorrectly by measuring from the wrong points
- Panicking and selling at the second bottom instead of recognizing the opportunity
Advanced Techniques
- Use the Adam and Eve double bottom classification where the first bottom is sharp and the second is rounded, which tends to have higher reliability
- Project Fibonacci extensions from the pattern for multiple take-profit levels
- Monitor the put-call ratio at the second bottom. Extreme put buying often confirms capitulation
- Use anchored VWAP from the first bottom to identify institutional cost basis
Institutional Perspective
Double bottoms are a favorite institutional pattern because the second test of support provides high-confidence proof that demand exceeds supply. Institutions often place their largest orders at the second bottom, having validated the support level on the first test.
Fun Facts
- The Double Bottom is one of Charles Dow's original chart patterns, making it over 120 years old in Western technical analysis.
- Thomas Bulkowski's research found the Double Bottom to be the most common reversal pattern, appearing about 3 times more frequently than Head and Shoulders.
- The Double Bottom was the pattern that marked the 2009 market bottom, though the second low was about 12% higher (ascending double bottom).
Frequently Asked Questions
No. The two bottoms should be approximately equal, generally within 3-4% of each other. An ascending double bottom where the second low is slightly higher is actually more bullish. The key is that price tests the same general support zone twice.
Measure the distance from the double bottom level to the neckline (middle peak). Add that distance above the neckline. For example, if the bottoms are at $40 and the neckline is at $48, the measured move target is $48 + $8 = $56.