Overview
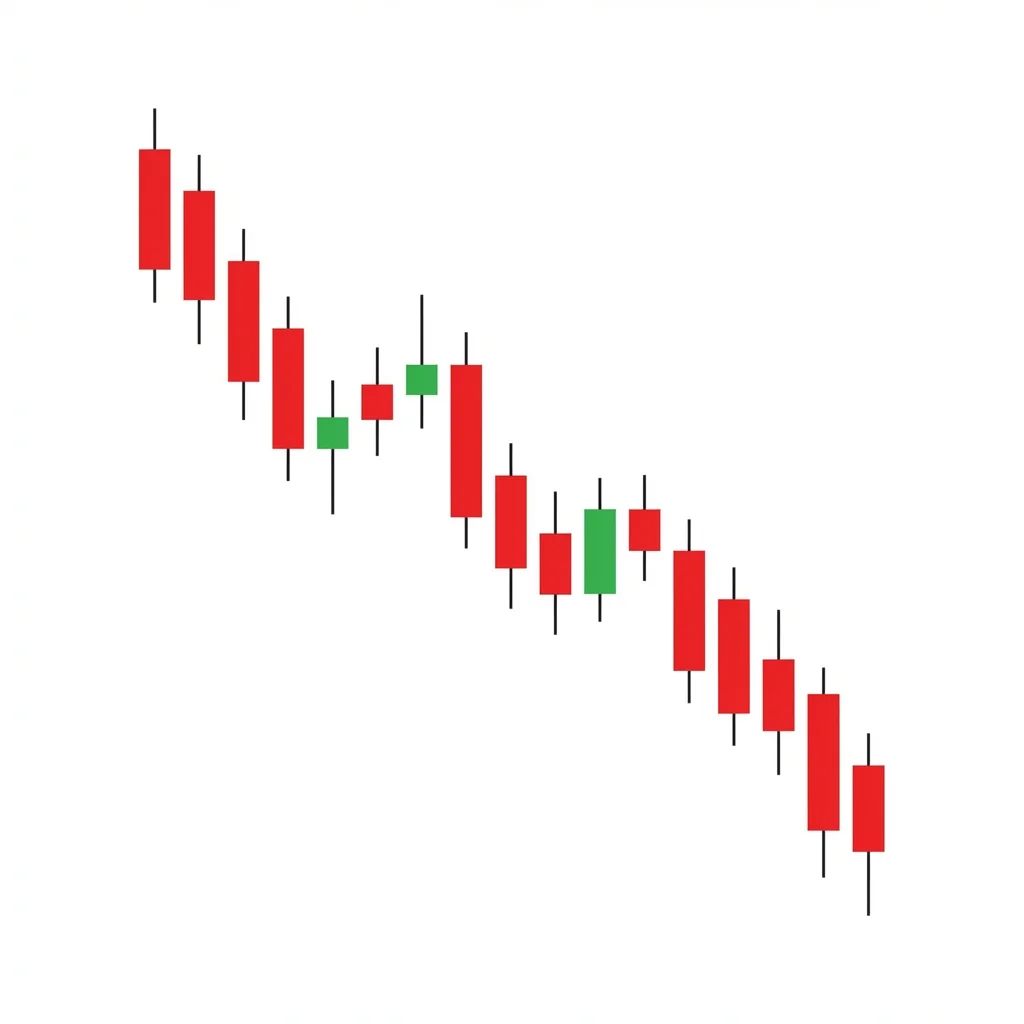
Bearish Descending Channel
Also known as: Descending Channel, Downward Channel, Falling Channel, Bear Channel
The Descending Channel is a chart formation where price trends lower within two parallel downward-sloping trendlines, making consistent lower highs and lower lows in an orderly bearish progression.
The Descending Channel is one of the most common and recognizable chart patterns. It consists of two parallel downward-sloping trendlines that contain the price action. The upper trendline acts as resistance (connecting lower highs), and the lower trendline acts as support (connecting lower lows). Price oscillates between these boundaries, creating a predictable rhythm that traders can exploit. The channel represents an orderly downtrend where sellers consistently push price lower while buyers provide temporary support at the lower boundary before sellers overwhelm them again. Channels can persist for weeks, months, or even years. Traders can trade within the channel (short at resistance, cover at support) or wait for the inevitable breakout, which can occur in either direction. A downside breakout below the channel accelerates the decline, while an upside breakout signals a potential trend reversal.
History & Etymology
Channel analysis has been a cornerstone of technical analysis since its earliest days. Charles Dow discussed the concept of trading ranges and trends in the late 1800s. The formal identification of channels as parallel trendlines was developed by early 20th-century technicians. Edwards and Magee codified channel analysis in their 1948 textbook, and it remains one of the most widely used technical tools today.
A 'channel' refers to a waterway between two banks — similarly, price flows between two parallel trendlines like water in a channel. 'Descending' indicates the channel slopes downward, reflecting a bearish trend.
How It Forms
Formation Steps
- 1Price makes a series of lower highs and lower lows
- 2Two parallel downward-sloping trendlines contain the price action
- 3The upper trendline connects at least two swing highs (resistance)
- 4The lower trendline connects at least two swing lows (support)
- 5Price oscillates between the two lines in an orderly fashion
Prerequisites
- At least two swing highs and two swing lows to define the channel
- The trendlines should be roughly parallel
- Price should respect both trendlines (touch or come near them multiple times)
Confirmation Signals
- Price respects both channel boundaries on multiple occasions
- Volume declines on rallies to the upper trendline and increases on declines to the lower
- Bearish reversal patterns appear at the upper trendline
- A break below the lower trendline confirms acceleration of the downtrend
Invalidation Signals
- Price breaks above the upper trendline on high volume
- Higher lows begin forming within the channel
- Volume increases on rallies rather than declines
Candle Breakdown
Rally to Upper Trendline
Price rallies from the lower trendline toward the upper trendline, forming a corrective wave within the downtrend.
Buyers attempt a counter-trend rally, but declining volume shows the buying is half-hearted. These rallies represent short-covering and bargain hunting.
Rejection at Upper Trendline
Price reaches the upper trendline and is rejected, forming a new lower high.
Sellers re-emerge at the upper boundary. The rejection confirms the downtrend is intact and the channel continues to contain price.
Decline to Lower Trendline
Price falls from the upper trendline toward the lower trendline, forming the impulsive wave of the downtrend.
Sellers are dominant. The decline from the upper trendline is typically faster and has more momentum than the preceding rally.
Psychology
The Descending Channel represents a market in an orderly retreat. Sellers consistently establish positions at the upper boundary, and buyers provide only temporary relief at the lower boundary. The predictable rhythm reflects a consensus that prices should be lower.
Buyer Perspective
Buyers attempt counter-trend rallies that are repeatedly capped at the upper trendline. Over time, their rallies become weaker and their conviction fades. The lower trendline provides temporary hope, but each new low erodes confidence.
Seller Perspective
Sellers have a clear plan: sell at the upper trendline and cover at the lower. The predictable pattern gives them confidence and a framework. They add to positions on each rally to resistance.
Smart Money Action
Institutions use the channel rhythm to scale into short positions. They sell on rallies to the upper trendline and add on breaks to new lows. The predictable structure provides ideal entry and risk management points.
Retail Trader Trap
Retail traders often try to buy the lower trendline support, expecting a bounce. While this works initially, each bounce is smaller, and eventually the lower support breaks, trapping bottom-fishers.
Emotional Cycle
Trading Strategy
Aggressive Entry
Short at the upper trendline on each touch, placing stops above the channel.
Conservative Entry
Wait for a confirmed break below the lower trendline, then short the retest.
The lower trendline (for within-channel trades).
The channel width projected below the breakdown point.
Major historical support levels below the channel.
Best Conditions
- Timeframe: daily
- Timeframe: weekly
- Timeframe: 4h
- established downtrend
- bear market
- post-distribution
- Asset: stocks
- Asset: indices
- Asset: forex
- Asset: crypto
Avoid When
- Timeframe: 1m
- choppy sideways market
- V-reversal environment
Confluence Factors
- Upper trendline aligns with a moving average (20 or 50 EMA)
- Bearish reversal candles form at the upper trendline
- Volume declines on rallies within the channel
- RSI fails to reach 50 on rallies (stays bearish)
- Lower timeframe shows distribution at the upper trendline
Scale In Strategy
Short 50% at the upper trendline, add 50% on the break of the most recent swing low.
Scale Out Strategy
Take 50% at the lower trendline, hold 50% for a potential breakdown.
Risk Management
Volume Analysis
Volume Confirmation
Volume should decline on rallies and increase on declines. This confirms that selling pressure is the dominant force.
Volume Profile
Healthy channels show a clear volume pattern: low on rallies, high on declines.
Volume Divergence
If volume starts increasing on rallies, the channel may be about to break upward.
Technical Confluence
Support Resistance
The channel boundaries ARE dynamic support and resistance. Each touch reinforces the levels.
Fibonacci Levels
The internal swings within the channel often retrace 38.2-50% before resuming. Fibonacci levels help time entries within the channel.
Moving Averages
The 20 EMA often coincides with the midline of the channel. The 50 SMA may align with the upper trendline, adding resistance.
Rsi Confirmation
RSI staying below 60 on rallies and making lower highs confirms the bearish channel momentum.
Macd Confirmation
MACD remaining below the zero line with bearish crossovers at the upper trendline confirms the downtrend.
Bollinger Bands
Bollinger Bands tend to slope downward within the channel, with the upper band near the channel resistance.
Vwap
The anchored VWAP from the channel start typically runs near the upper trendline, acting as dynamic resistance.
Ichimoku Cloud
Price below the Kumo cloud within a descending channel is a strong bearish setup.
Elliott Wave
Descending channels often contain impulsive Wave C declines or Wave 3 of a larger bearish impulse.
Wyckoff Phase
The descending channel represents the Markdown phase in the Wyckoff cycle.
Market Profile
The value area migrates lower over time as the channel develops, confirming the bearish trend.
Order Flow
Watch for passive selling at the upper trendline and passive buying at the lower trendline.
Open Interest
In futures, rising OI during the decline and declining OI on rallies confirms the bearish structure.
Multi-Timeframe Analysis
Higher Timeframe Alignment
A daily descending channel within a weekly downtrend is a high-conviction setup for trading from the upper line.
Lower Timeframe Entry
Use the 1H or 4H chart to time entries at the daily channel's upper trendline.
Timeframe Confluence
A weekly descending channel with daily bearish reversal patterns at the upper line provides excellent confluence.
Top-Down Approach
Weekly: identify the channel. Daily: trade the swings. 4H: time entries and exits.
Statistics
Historical Examples
S&P 500 Descending Channel 2022
successThe S&P 500 traded in a well-defined descending channel from January to October 2022, declining from 4,800 to 3,500. Multiple swing trades from the upper trendline to the lower were profitable. The eventual breakout above the channel in November signaled the end of the bear market.
Lesson: The descending channel provided a reliable framework for swing trading throughout the 2022 bear market. Multiple touches on both boundaries confirmed the pattern's reliability.
Variations
Steep Descending Channel
A channel with a steep angle (more than 45 degrees), indicating aggressive selling.
Gentle Descending Channel
A shallow-angle channel that declines slowly over a long period.
Confusion Matrix
Patterns commonly confused with Bearish Descending Channel and how to distinguish them.
Bearish Descending Triangle
5500% similarCheck the lower boundary. If it is flat/horizontal, it is a Descending Triangle. If it slopes downward (parallel to the upper line), it is a Descending Channel.
Key Differences
- Descending Triangle has a flat bottom (horizontal support) and declining tops
- Descending Channel has both declining tops AND declining bottoms (parallel)
- Descending Triangle leads to a breakdown; Channel can continue indefinitely
Bearish Flag
6000% similarDuration and context. A Flag is a brief counter-trend consolidation after a sharp move. A Descending Channel is the trend itself.
Key Differences
- A Flag is a short-term pattern (typically 5-15 bars) within a larger downtrend
- A Descending Channel is a medium to long-term pattern (15-200+ bars)
- A Flag is preceded by a sharp 'flagpole' decline
The Descending Triangle is a bearish continuation pattern featuring a flat support level with lower highs converging into an apex, typically resolving with a breakdown below the horizontal support as sellers gradually overwhelm buyers.
The bearish flag is a continuation pattern consisting of a sharp decline (flagpole) followed by a gentle upward-sloping consolidation (flag) before price breaks down to continue the trend.
Bearish lower highs is a fundamental trend structure pattern where each successive swing high forms at a lower level, confirming bearish momentum and a downtrend. It is the most basic and important bearish market structure signal.
Three black crows is a powerful bearish reversal pattern consisting of three consecutive long bearish candles, each opening within the prior candle's body and closing near its low. It signals strong, persistent selling pressure and a likely trend reversal.
The Bullish Ascending Channel is a continuation pattern where price trends upward within two parallel trendlines, providing clear buy zones at the lower boundary and profit targets at the upper boundary.
The Broadening Top (Megaphone) is a chart formation characterized by expanding price swings that create higher highs and lower lows, reflecting increasing volatility and instability at market tops before a bearish breakdown.
Pro Tips & Common Mistakes
Pro Tips
- The channel is one of the most tradeable patterns because it provides clear entry (upper line), exit (lower line), and stop (above the channel) levels.
- The longer a channel persists and the more touches on each boundary, the more reliable it becomes. But be aware that the eventual breakout can be powerful.
- Always trade in the direction of the channel. Buying at the lower boundary for a counter-trend bounce is risky — only do so with tight stops.
- The midline of the channel often acts as an intermediate support/resistance level.
- Watch for the angle of the channel. Steep channels break sooner. Gentle channels can persist for very long periods.
Common Mistakes
- Buying at the lower trendline without recognizing that the overall trend is bearish — these bounces get smaller over time.
- Drawing channels with only one touch on each side — require at least two touches per line for validity.
- Ignoring that channels eventually break. Have a plan for both an upside and downside breakout.
- Using channels on very short timeframes where noise creates false boundaries.
Advanced Techniques
- Calculate the channel width and use it as a measured move target for the eventual breakdown.
- Use the channel on a higher timeframe and trade individual patterns (engulfing, shooting star) on a lower timeframe at the channel boundaries.
- The speed of the oscillation within the channel can indicate impending breakout — faster oscillations (shorter swings) suggest energy is building.
Institutional Perspective
Institutions often create descending channels through systematic selling programs. They sell predetermined amounts at each rally, creating the upper trendline resistance. Algorithmic trading programs that recognize the channel boundaries contribute to the pattern's persistence.
Fun Facts
- Descending channels are one of the most common chart patterns in all of technical analysis. Studies show they appear in virtually every market and timeframe.
- The longest documented descending channel in a major US stock lasted over 3 years (GE from 2017-2020).
- Algorithmic trading has made channels more precise and reliable because programs recognize and trade the boundaries, reinforcing the pattern.
Frequently Asked Questions
Connect at least two swing highs for the upper trendline and at least two swing lows for the lower trendline. The lines should be roughly parallel. More touches on each line increase validity.
Both approaches work. Trading within the channel (short at resistance, cover at support) provides multiple opportunities but requires active management. Waiting for the breakout (either direction) provides higher-conviction trades with fewer entries.
Warning signs include: volume increasing on one side (breakout direction), the swings getting shorter/faster, price failing to reach one boundary, and divergence on RSI or MACD.