Overview
Bullish Dragonfly Doji
Tonbo
Also known as: T-Doji, Dragonfly, Long-Tailed Doji
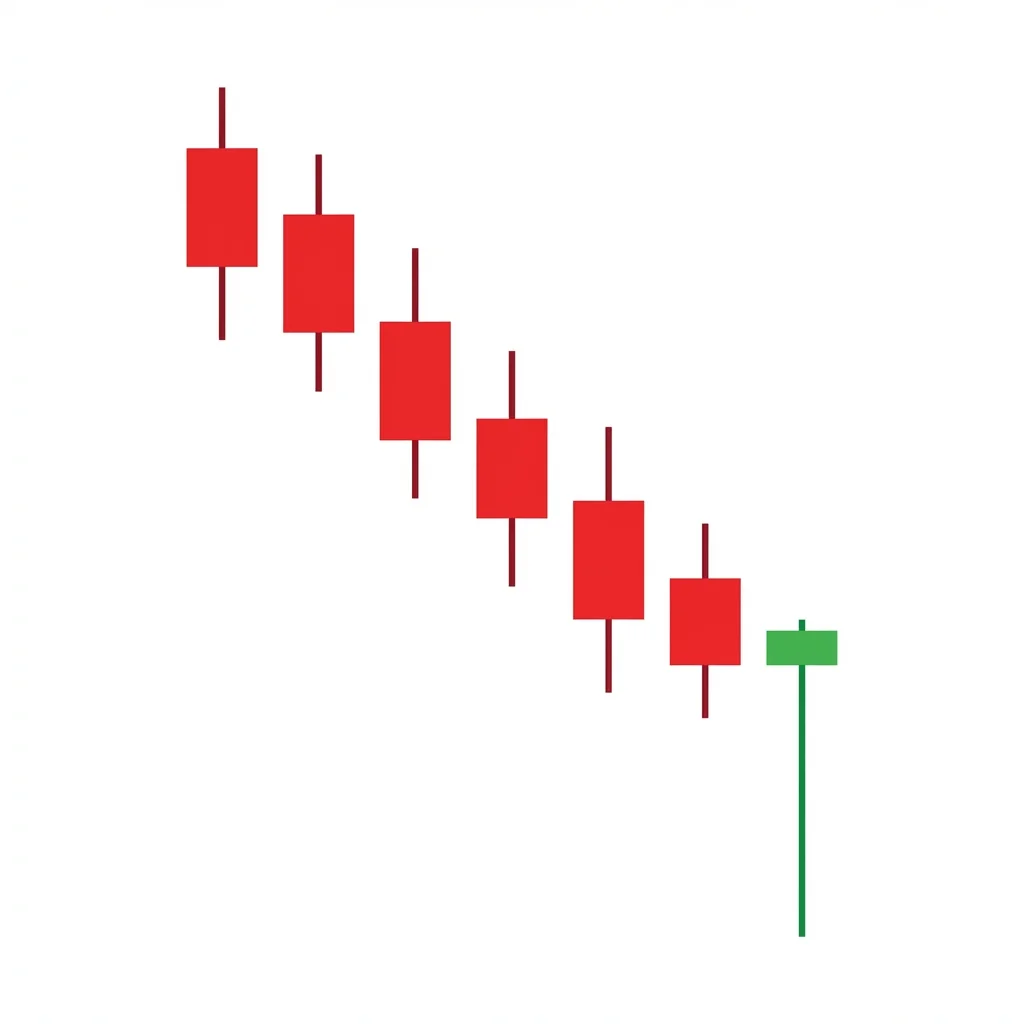
The Dragonfly Doji is a powerful single-candle reversal signal where sellers push price significantly lower during the session, but buyers fight back to close at the opening level, creating a T-shaped candle that signals complete rejection of lower prices.
The Dragonfly Doji is one of the most visually striking candlestick patterns. It forms when the open, high, and close are all at or near the same price at the top of the candle, with a long lower shadow extending below. This shape looks like a T or a dragonfly. The long lower shadow shows that sellers pushed price significantly lower during the session, but buyers counterattacked so aggressively that they recovered the entire decline by the close. In a downtrend, this complete intraday recovery signals that selling pressure has been met with equal or greater buying force. The dragonfly doji at a bottom is essentially the same shape as a hammer, with the key distinction being that the open and close are truly equal (doji body).
History & Etymology
The Dragonfly Doji has been part of Japanese candlestick analysis for centuries. In Japanese, Tonbo means dragonfly, referring to the T-shape resembling a dragonfly in flight. It was considered one of the most important single-candle reversal signals by Munehisa Homma.
Named for its resemblance to a dragonfly with outstretched wings. The horizontal line at the top represents the body, and the long lower shadow represents the tail. The Japanese name Tonbo directly translates to dragonfly.
How It Forms
Formation Steps
- 1Open, high, and close are all at or very near the same level (top of the candle)
- 2Long lower shadow, at least 2-3x the body length
- 3No upper shadow (or extremely small)
Prerequisites
- Prior downtrend for reversal significance
- The lower shadow should be notably long relative to recent candles
Confirmation Signals
- Next candle closes bullish and above the dragonfly high
- Volume increases on the dragonfly session
- Price does not revisit the dragonfly low
Invalidation Signals
- Price breaks below the dragonfly low
- Next candle is bearish and closes below the dragonfly
- No follow-through within 2 sessions
Candle Breakdown
Dragonfly Doji
Open, close, and high are at the same level with a long lower shadow.
Sellers had full control early in the session, pushing price dramatically lower. But buyers mounted a complete counterattack, recovering every lost point by the close. This total recovery is a powerful statement of buyer determination.
Psychology
The Dragonfly Doji tells a dramatic intraday story: sellers attacked, drove price sharply lower, and buyers fought back to erase all losses. The close at the high of the session means buyers had the last word.
Buyer Perspective
Buyers who defended the low saw their conviction rewarded by the close. The total recovery signals that demand at lower prices is overwhelming.
Seller Perspective
Sellers who drove price lower saw all their progress reversed. Ending the session at the high is demoralizing and suggests their selling power is spent.
Smart Money Action
Institutional buyers often create dragonfly dojis by placing large limit buy orders at key support levels, absorbing all selling and pushing price back to the open.
Retail Trader Trap
Retail traders who sold during the intraday decline were selling at the worst prices. The total recovery trapped them in losing positions.
Emotional Cycle
Trading Strategy
Aggressive Entry
Enter long at the close of the dragonfly doji, especially at a key support level.
Conservative Entry
Wait for the next candle to close above the dragonfly high (confirming the reversal).
Equal to the lower shadow length projected above the close.
At the nearest overhead resistance.
Prior swing high.
Best Conditions
- Timeframe: 4h
- Timeframe: daily
- Timeframe: weekly
- At key support levels in downtrends
- During oversold conditions
- At major moving averages
- Asset: stocks
- Asset: forex
- Asset: crypto
- Asset: futures
Avoid When
- Timeframe: 1m
- Timeframe: 5m
- In freefall markets
- Far from any support
Confluence Factors
- At a Fibonacci retracement level
- At a major moving average
- At horizontal support
- RSI oversold
- Volume spike
Scale In Strategy
Enter 50% on the dragonfly close, add 50% on confirmation.
Scale Out Strategy
Take 50% at the shadow-length target, trail the rest.
Risk Management
Volume Analysis
Volume Confirmation
High volume during the dragonfly session confirms institutional participation. Low volume makes the pattern less significant.
Volume Profile
Heavy volume near the session low indicates strong buying absorption at that level.
Volume Divergence
Low volume on the dragonfly suggests a low-participation session where the signal is weaker.
Technical Confluence
Support Resistance
A dragonfly doji at a well-established support level is one of the highest-conviction single-candle setups.
Fibonacci Levels
The lower shadow often pierces through a Fibonacci level before recovering, confirming the retracement is complete.
Moving Averages
Dragonfly dojis bouncing off the 50 or 200 SMA are textbook setups.
Rsi Confirmation
RSI below 30 during the dragonfly and turning up confirms the reversal.
Macd Confirmation
MACD showing decreasing negative momentum supports the reversal thesis.
Bollinger Bands
The lower shadow piercing the lower Bollinger Band with recovery inside is a classic mean-reversion signal.
Vwap
On intraday charts, the lower shadow dipping below VWAP and closing above it shows buyer control.
Ichimoku Cloud
A dragonfly at the Kijun-sen or Senkou Span provides Ichimoku confirmation.
Elliott Wave
May mark the end of a Wave 5 decline or a C wave correction.
Wyckoff Phase
The dragonfly often resembles a spring event in miniature.
Market Profile
Creates a long rejection tail in the market profile, a strong signal of value rejection at lower prices.
Order Flow
Massive delta swing from negative to positive during the session shows aggressive buying absorbed the selling.
Open Interest
In futures, open interest changes during the dragonfly show positioning shifts.
Multi-Timeframe Analysis
Higher Timeframe Alignment
A daily dragonfly at weekly support is the ideal setup.
Lower Timeframe Entry
Use the 1-hour chart to watch the recovery unfold during the dragonfly session.
Timeframe Confluence
A weekly dragonfly doji is rare but extremely powerful.
Top-Down Approach
Weekly support, daily dragonfly doji, 4-hour confirms reversal.
Statistics
Historical Examples
Bitcoin Dragonfly Doji at $30k Support
partialBitcoin formed a dragonfly doji at $30,000 support, dipping to $17,600 intraday before recovering to close near $20,000. While not a perfect immediate reversal, it marked the area of the eventual bottom.
Lesson: Dragonfly dojis in crypto can have extremely long shadows due to high volatility. The lower shadow often marks significant support even if the immediate reversal takes time.
Variations
Long-Tailed Dragonfly
Shadow is 4-5x the body, indicating extreme rejection.
Confusion Matrix
Patterns commonly confused with Bullish Dragonfly Doji and how to distinguish them.
Bullish Hammer
8500% similarIf the open and close are truly at the same price (or within 0.1%), it is a dragonfly doji. If there is a visible body, it is a hammer.
Key Differences
- Hammer has a small body at the top; dragonfly doji has open=close (true doji)
- Both have long lower shadows and signal the same psychology
The gravestone doji is a single-candle reversal pattern with the open, close, and low at the same level and a long upper shadow, resembling a gravestone. It signals that buyers pushed price higher but sellers reclaimed all gains by the close.
The Bullish Engulfing is one of the most popular and reliable two-candle reversal patterns. A large bullish candle completely engulfs the prior bearish candle body, signaling a decisive shift from selling to buying control.
A candle with a long lower shadow signals that buyers aggressively rejected lower prices during the session, pushing price back up from the lows. This buying pressure suggests a potential bottom or support level.
The Bullish Takuri is a single-candle reversal pattern characterized by an extremely long lower shadow and a tiny body near the candle's high. It is a stronger version of the hammer, indicating aggressive rejection of lower prices and a high probability of trend reversal.
The Bullish Three Inside Up is a three-candle reversal pattern that combines a bullish harami with a confirming third candle that closes above the first candle's open, providing a more reliable reversal signal than the harami alone.
The Bearish Belt Hold is a single bearish candle that opens at its high and closes near its low with a long body, indicating that sellers dominated from the opening bell and controlled price action throughout the session.
Pro Tips & Common Mistakes
Pro Tips
- The longer the lower shadow relative to recent candles, the more significant the rejection signal
- A dragonfly doji at a confluence of support levels (horizontal, MA, Fibonacci) has the highest win rate
- Always require confirmation. Single-candle patterns fail too often to trade blindly
- The dragonfly doji low often marks a significant support level that holds for weeks or months
Common Mistakes
- Trading every dragonfly doji without considering the location and context
- Not waiting for confirmation from the next session
- Placing stops above the dragonfly low rather than below it
- Confusing a dragonfly doji with a regular hammer
Advanced Techniques
- Use the dragonfly shadow length to estimate the stop distance, then calculate position size for optimal risk management
- Monitor the intraday chart during the dragonfly session to see where the buying began
- Combine with Level 2 data to see if large bids appeared near the session low
Institutional Perspective
The dragonfly doji often results from institutional buy programs that execute at key support levels. The long shadow represents the liquidity sweep, and the recovery represents institutional absorption of that liquidity.
Fun Facts
- The dragonfly is a symbol of strength, courage, and happiness in Japanese culture, making it a fitting name for this bullish reversal pattern.
- The dragonfly doji is mathematically the mirror image of the gravestone doji, and the two form an elegant symmetry in candlestick theory.
Frequently Asked Questions
They are very similar and signal the same psychology. The technical difference is that a dragonfly doji has the open and close at exactly the same price (true doji body), while a hammer has a small but visible body. In practice, most traders treat them as functionally equivalent.