Overview
Bullish Takuri
Takuri (探り)
Also known as: Takuri Line, Long-Legged Hammer, Probing Line
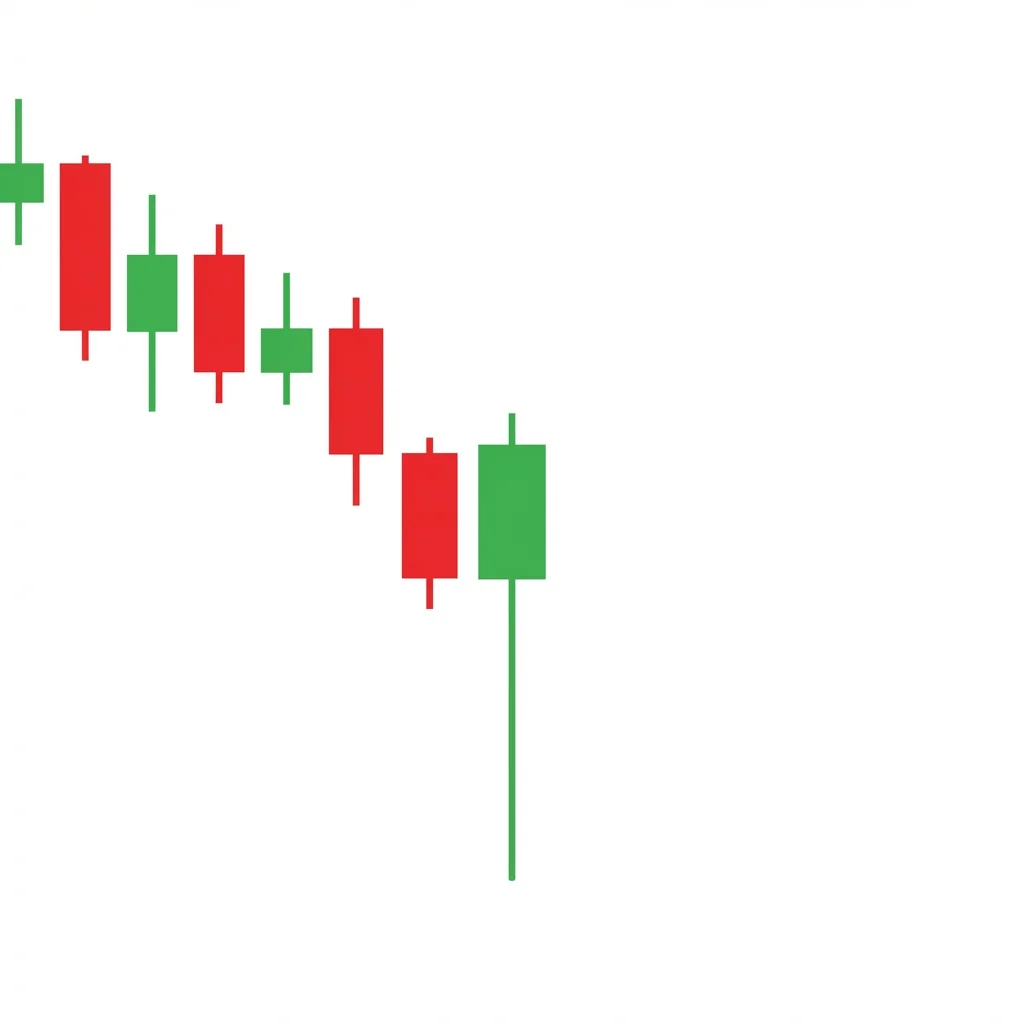
The Bullish Takuri is a single-candle reversal pattern characterized by an extremely long lower shadow and a tiny body near the candle's high. It is a stronger version of the hammer, indicating aggressive rejection of lower prices and a high probability of trend reversal.
The Takuri (meaning 'probing for the bottom' in Japanese) is considered more powerful than a standard hammer because of its exceptionally long lower shadow. During the session, sellers pushed price dramatically lower, but buyers reversed the entire move, closing near the open. The extreme length of the lower shadow — at least three times the body — shows an emphatic rejection of lower prices. This level of reversal within a single session signals that demand at lower prices is overwhelming, often marking significant bottoms.
History & Etymology
The Takuri line comes from traditional Japanese candlestick charting and is one of the oldest single-candle reversal signals. The name originates from the Japanese concept of 'probing' or 'searching for the bottom with your foot.' It was distinguished from the standard hammer by Japanese chartists due to its more extreme proportions.
The word 'takuri' (探り) means 'to probe' or 'to search by feel' in Japanese. It describes the act of probing for the bottom of a river with one's foot — testing the depth before stepping in. The candle 'probes' for the bottom of the market.
How It Forms
Formation Steps
- 1A single candle with a very small real body at the top of the trading range
- 2An extremely long lower shadow — at least three times the body length
- 3Little to no upper shadow
Prerequisites
- Established downtrend
- Lower shadow must be at least three times the body length (longer than a standard hammer)
- Body can be either bullish or bearish but should be very small
Confirmation Signals
- Next candle closes above the takuri's high
- Volume is elevated on the takuri candle
- Follow-through buying on subsequent bars
Invalidation Signals
- Next candle closes below the takuri's low
- Price fails to follow through above the takuri
- Volume is low on the takuri (no commitment)
Candle Breakdown
Takuri Candle
A candle with an extremely long lower shadow (3x+ body length), a very small body near the top, and little to no upper shadow
Sellers drove price dramatically lower during the session, but buyers mounted a complete reversal. The extreme lower shadow shows that every sell order was absorbed and buyers pushed price back to near the open. This is one of the strongest single-candle reversal signals.
Psychology
The Takuri represents a dramatic intraday battle that buyers decisively win. The extreme lower shadow shows that sellers made a powerful attempt to push prices lower but were completely overwhelmed by buying demand.
Buyer Perspective
Buyers waited for the decline to reach extreme levels before stepping in aggressively. Their buying was so strong that it reversed the entire session's decline, demonstrating their conviction.
Seller Perspective
Sellers appeared to be in complete control during the session's low point, but their confidence was shattered as every gain was erased. The complete reversal signals that sellers have no follow-through capacity.
Smart Money Action
The extreme lower shadow often represents institutional buying programs activating at predetermined support levels. The aggressive buying at the session lows fills their orders at optimal prices.
Retail Trader Trap
Retail traders who sold into the decline or shorted during the intraday drop are completely reversed. Their sell orders at the lows provided the liquidity that institutions used to buy.
Emotional Cycle
Trading Strategy
Aggressive Entry
Enter long at the close of the takuri candle.
Conservative Entry
Wait for the next candle to close above the takuri's high for confirmation.
The previous swing low before the decline that produced the takuri.
1:1 risk-reward ratio (often a significant move given the long shadow).
The 50% retracement of the entire decline.
Best Conditions
- Timeframe: daily
- Timeframe: weekly
- Timeframe: 4h
- after extended downtrends
- at key support levels
- during oversold conditions
- Asset: stocks
- Asset: crypto
- Asset: forex
- Asset: commodities
Avoid When
- Timeframe: 1m
- Timeframe: 5m
- gradual decline without a sharp probe
- low-volatility environments
- in the middle of a range
Confluence Factors
- The takuri forms at a major support level
- RSI is deeply oversold (below 25)
- Volume is significantly above average
- The lower shadow reaches a Fibonacci level (61.8% or 78.6%)
- Bullish divergence on momentum indicators
Scale In Strategy
Enter a starter at the takuri close and add on confirmation from the next candle.
Scale Out Strategy
Take one-third at the first target, one-third at the second, and trail the rest.
Risk Management
Volume Analysis
Volume Confirmation
High volume on the takuri candle significantly increases reliability — it confirms that the reversal was backed by real commitment.
Volume Profile
Volume spike at the session low followed by sustained buying volume throughout the reversal is the ideal profile.
Volume Divergence
Low volume on the takuri suggests the reversal may not be genuine — a probe without conviction.
Technical Confluence
Support Resistance
The takuri's extreme lower shadow tests support decisively. The shadow's tip often marks the exact support test point.
Fibonacci Levels
The shadow tip reaching the 61.8% or 78.6% Fibonacci retracement is a powerful confluence signal.
Moving Averages
A takuri at the 200-day moving average is one of the most reliable single-candle reversal signals.
Rsi Confirmation
RSI below 20-25 at the takuri, especially with bullish divergence, dramatically increases win rate.
Macd Confirmation
MACD histogram bottoming and beginning to contract at the takuri signals momentum shift.
Bollinger Bands
A takuri piercing below the lower Bollinger Band and closing back within the bands is a classic reversal setup.
Vwap
Intraday takuri below VWAP with a close back above VWAP is very strong.
Ichimoku Cloud
A takuri at or below the Kumo cloud with the shadow testing cloud support adds confluence.
Elliott Wave
Takuri candles often mark the end of Wave 5 or Wave C terminations.
Wyckoff Phase
The takuri can represent the selling climax or spring within a Wyckoff accumulation schematic.
Market Profile
The extreme lower shadow often tests the Value Area Low or prior poor low on the market profile.
Order Flow
Delta divergence during the candle (negative delta at the low, then sharply positive delta) confirms the reversal.
Open Interest
Declining open interest on the decline into the takuri (liquidation of longs) followed by rising OI on the bounce.
Multi-Timeframe Analysis
Higher Timeframe Alignment
A weekly takuri is more significant than a daily one. Monthly takuri candles can mark multi-year bottoms.
Lower Timeframe Entry
Use the 1-hour chart to time entry within the daily takuri's reversal zone (the lower portion of the shadow).
Timeframe Confluence
A weekly support level with a daily takuri and 4-hour bullish confirmation is the ideal setup.
Top-Down Approach
Weekly identifies the support level, daily identifies the takuri, and 4-hour times the entry.
Statistics
Historical Examples
SPY March 2020 Takuri
successSPY printed a takuri candle at the COVID bottom with an extreme lower shadow reaching $218 before closing near $228. The candle marked the exact bottom of the crash.
Lesson: Takuri candles at major market bottoms during extreme fear events can mark generational buying opportunities.
Gold Weekly Takuri
successGold printed a weekly takuri candle near $1,620 with an extreme lower shadow. This marked the bottom, and gold subsequently rallied above $2,000.
Lesson: Weekly takuri candles are more significant than daily ones and can mark major turning points in commodity markets.
Failed Takuri in Bear Trend
failureMETA formed a takuri candle after the earnings crash, but the fundamental deterioration was severe and the stock continued lower for months.
Lesson: Takuri candles can fail in strong bear trends with deteriorating fundamentals. Always consider the broader context.
Variations
Bullish Body Takuri
The small body is bullish (close above open), adding a slight bullish bias.
Bearish Body Takuri
The small body is bearish (close below open) but the extreme shadow still signals reversal.
Confusion Matrix
Patterns commonly confused with Bullish Takuri and how to distinguish them.
Bullish Hammer
8500% similarMeasure the lower shadow relative to the body. If it is 2x-3x, it is a hammer. If it is 3x or more, it is a takuri.
Key Differences
- A hammer requires a lower shadow at least 2x the body length
- A takuri requires a lower shadow at least 3x the body length — it is more extreme
Bullish Dragonfly Doji
7000% similarIf the body is visible (even if small), it is a takuri. If the open and close are at the same price, it is a dragonfly doji.
Key Differences
- Dragonfly doji has virtually no real body (open equals close)
- Takuri has a small but visible real body
The shooting star is a single-candle bearish reversal pattern with a small body near the low and a long upper shadow. It shows that buyers pushed price significantly higher during the session but sellers drove it back down, signaling a potential top.
The Dragonfly Doji is a powerful single-candle reversal signal where sellers push price significantly lower during the session, but buyers fight back to close at the opening level, creating a T-shaped candle that signals complete rejection of lower prices.
The Bullish Engulfing is one of the most popular and reliable two-candle reversal patterns. A large bullish candle completely engulfs the prior bearish candle body, signaling a decisive shift from selling to buying control.
A candle with a long lower shadow signals that buyers aggressively rejected lower prices during the session, pushing price back up from the lows. This buying pressure suggests a potential bottom or support level.
The Bearish Belt Hold is a single bearish candle that opens at its high and closes near its low with a long body, indicating that sellers dominated from the opening bell and controlled price action throughout the session.
The Bearish Closing Marubozu is a single bearish candle with no lower shadow — the close is at the exact low of the session. This indicates that sellers controlled the session and maintained pressure through the very last trade, a sign of strong bearish conviction.
Pro Tips & Common Mistakes
Pro Tips
- The longer the lower shadow relative to the body, the more powerful the reversal signal — takuri are specifically stronger than standard hammers
- The takuri is most reliable at major support levels where institutional buying programs are likely activated
- Volume must be above average for the takuri to be meaningful — a low-volume probe is unreliable
- The 50% level of the takuri's shadow often acts as support on any retest
- A bullish body (close above open) on the takuri is slightly more bullish than a bearish body, but both are valid
Common Mistakes
- Not distinguishing between a takuri (extreme shadow) and a regular hammer (moderate shadow)
- Trading the takuri without waiting for confirmation from the next candle
- Setting stops at the exact takuri low instead of slightly below it
- Ignoring the broader trend — takuri in the middle of a strong downtrend with bad fundamentals often fail
- Using too large a position size given the wide stop below the extreme shadow
Advanced Techniques
- Use the takuri's shadow as a market structure indicator — the shadow tip marks a key demand zone for future reference
- Combine with order flow analysis: look for absorption of sell orders at the shadow low and aggressive buying on the reversal
- Apply the takuri to multiple timeframes — a weekly takuri at a monthly support level is extremely powerful
- Use options: buy calls at the takuri close with the strike near the takuri high for leveraged exposure with defined risk
Institutional Perspective
The extreme lower shadow of a takuri often represents institutional buying programs activating at predetermined price levels. The dramatic intraday reversal shows that institutional demand was overwhelming at the session's low. Large players view the takuri as evidence that their accumulation thesis is correct.
Fun Facts
- The word 'takuri' literally means 'probing for the bottom with your foot' — one of the most poetically descriptive names in candlestick analysis.
- Some Japanese candlestick purists consider the takuri to be a distinct pattern from the hammer, while Western traders often group them together.
- Statistical studies show that takuri candles with shadows exceeding 4x the body length have significantly higher reversal success rates than standard hammers.
Frequently Asked Questions
The Bullish Takuri is a single-candle reversal pattern with an extremely long lower shadow (at least 3x the body length) and a small body near the top. It is a stronger version of the hammer, indicating powerful rejection of lower prices.
The takuri has a more extreme lower shadow (3x+ the body) compared to a standard hammer (2x+ the body). This makes the takuri a stronger reversal signal due to the more dramatic price rejection.
A bullish body (close above open) is slightly preferred, but both bullish and bearish bodies are valid. The extreme lower shadow is the primary signal, not the body color.