Overview
Bullish Long Lower Shadow
Also known as: Long Wick Bottom, Buying Tail, Demand Candle
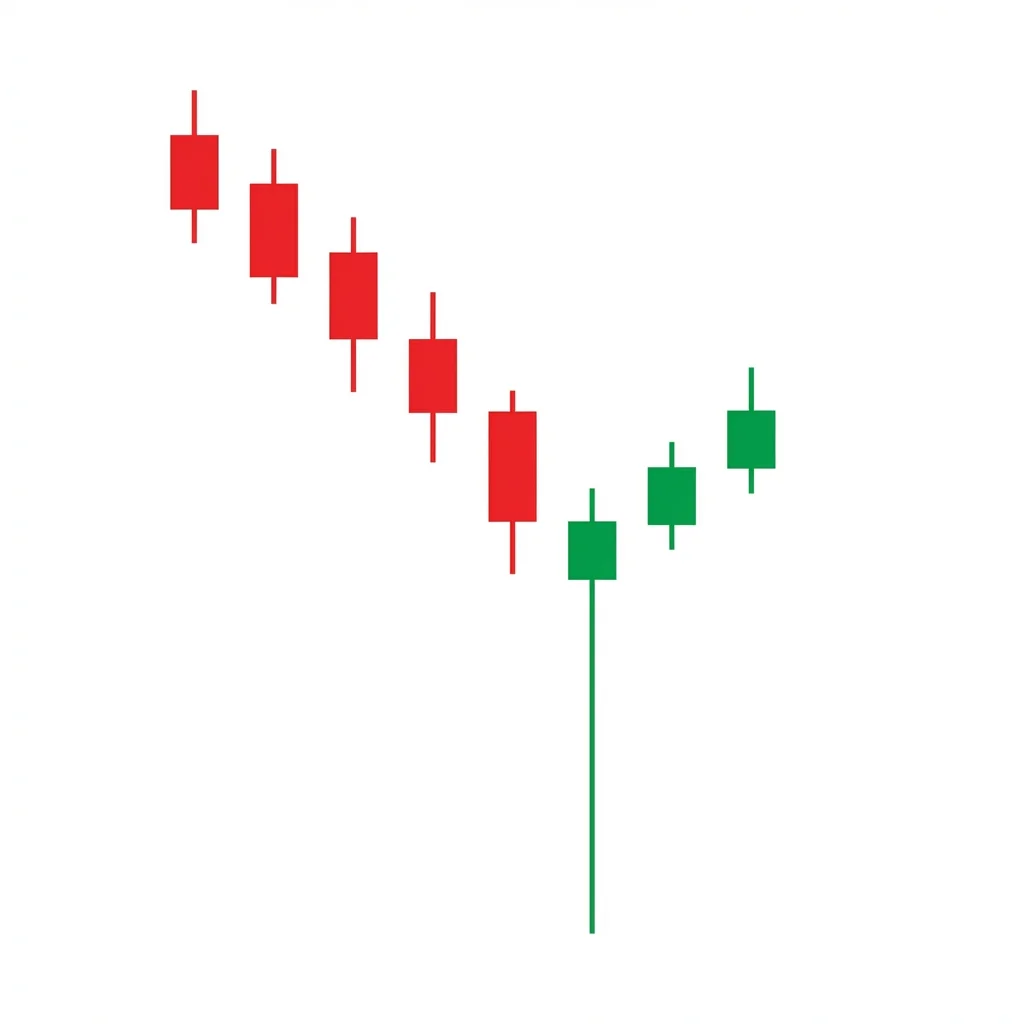
A candle with a long lower shadow signals that buyers aggressively rejected lower prices during the session, pushing price back up from the lows. This buying pressure suggests a potential bottom or support level.
The Long Lower Shadow candle is one of the most intuitive bullish signals. During the session, sellers push price significantly lower, but buyers respond aggressively, driving price back up well above the lows. The resulting long lower shadow is a visual record of this buying demand. While the pattern encompasses hammers, takuri lines, and dragonfly dojis, the general concept of a long lower shadow appearing in a downtrend is a fundamental bullish signal that every trader should recognize. The longer the shadow relative to the body, the stronger the rejection of lower prices.
History & Etymology
The significance of candle shadows has been recognized since the earliest Japanese candlestick texts. The lower shadow was seen as a measure of buying demand strength — the longer the shadow, the more aggressively buyers defended a price level.
The name is purely descriptive — it refers to the long lower shadow (also called a wick or tail) extending below the candle's body, indicating that prices traded much lower during the session but were rejected.
How It Forms
Formation Steps
- 1A candle with a lower shadow at least 2-3 times the length of the real body
- 2The body can be bullish or bearish but should be relatively small
- 3The lower shadow shows aggressive rejection of lower prices
Prerequisites
- Downtrend or pullback context
- Lower shadow at least twice the body length
- Candle appears at a potential support area
Confirmation Signals
- Next candle closes above the long-shadow candle's body
- Volume was elevated during the session
- RSI shows oversold conditions
Invalidation Signals
- Next candle closes below the long lower shadow
- Price continues lower without pause
- No bullish follow-through
Candle Breakdown
Long Lower Shadow Candle
A candle with a notably long lower shadow showing intraday rejection of lower prices
Sellers pushed price aggressively lower but buyers stepped in with force, reclaiming most of the decline. The long shadow records this battle.
Psychology
The long lower shadow is the market's way of showing where demand exists. Sellers tested lower prices and were firmly rejected, revealing a floor of buying interest.
Buyer Perspective
Buyers see the long shadow as proof that demand exists at lower prices. The aggressive recovery from the low gives them confidence that a support level has been found.
Seller Perspective
Sellers who pushed price lower are frustrated by the recovery. The long shadow shows their attempt to extend the decline was overwhelmed by buying pressure.
Smart Money Action
The long shadow often reveals institutional limit buy orders at the low. Smart money defends key levels, and the shadow shows exactly where their orders were triggered.
Retail Trader Trap
Retail traders who panic-sold at the session low sold at the worst possible price — right into institutional buy orders.
Emotional Cycle
Trading Strategy
Aggressive Entry
Enter at the close of the long-shadow candle if it closes in the upper half of its range.
Conservative Entry
Wait for the next candle to close above the shadow candle's body.
1:1 R:R based on shadow length.
Previous swing high.
2:1 R:R.
Best Conditions
- Timeframe: daily
- Timeframe: 4h
- Timeframe: 1h
- Timeframe: weekly
- at support levels
- oversold conditions
- after pullbacks in uptrends
- Asset: stocks
- Asset: forex
- Asset: crypto
- Asset: commodities
- Asset: indices
Avoid When
- Timeframe: 1m
- free-falling markets
- no support nearby
- capitulation events that continue
Confluence Factors
- Key support level
- RSI oversold
- Moving average support
- Fibonacci level
- High volume on the candle
Scale In Strategy
Enter on the shadow candle, add on the confirmation candle.
Scale Out Strategy
Scale out at profit targets.
Risk Management
Volume Analysis
Volume Confirmation
High volume on the long-shadow candle confirms genuine buying interest at the low.
Volume Profile
Volume concentrated at the shadow low shows institutional buying.
Volume Divergence
Low volume reduces the signal's significance.
Technical Confluence
Support Resistance
The tip of the lower shadow marks the exact price level where demand overwhelmed supply.
Fibonacci Levels
Long shadows at Fibonacci retracements confirm the level's significance.
Moving Averages
A long shadow bouncing off the 50 or 200-day MA is a strong signal.
Rsi Confirmation
RSI below 30 with a long lower shadow is a high-probability reversal setup.
Macd Confirmation
MACD histogram flattening on the shadow candle supports the reversal.
Bollinger Bands
Shadow piercing the lower band with body closing inside shows mean-reversion potential.
Vwap
Long shadow below VWAP with close above it shows institutional defense.
Ichimoku Cloud
Shadow touching cloud support with body above is bullish.
Elliott Wave
Long shadows often appear at wave termination points.
Wyckoff Phase
The long shadow can represent a spring or test in Wyckoff accumulation.
Market Profile
The shadow tip at the Value Area Low marks institutional defense.
Order Flow
The shadow reveals passive buy absorption of aggressive sell orders.
Open Interest
Stable OI during the shadow suggests the decline was rejected, not covered.
Multi-Timeframe Analysis
Higher Timeframe Alignment
A weekly long shadow at a major level confirms daily trading setups.
Lower Timeframe Entry
After a daily long shadow, use the 1H chart for a precise bounce entry.
Timeframe Confluence
Long shadows at the same price level on multiple timeframes show strong institutional defense.
Top-Down Approach
Identify weekly support with long shadows, trade daily setups at that level.
Statistics
Historical Examples
SPY Long Shadow at 200-DMA
successSPY printed a long lower shadow at the 200-day moving average near $410. The shadow showed aggressive buying at the MA level, and the market rallied 10% over the next month.
Lesson: Long shadows at major moving averages are among the most reliable reversal signals.
Variations
Hammer
A long lower shadow candle with a small body in the upper third and no upper shadow.
Dragonfly Doji
A long lower shadow candle where the open and close are at the high of the candle.
Confusion Matrix
Patterns commonly confused with Bullish Long Lower Shadow and how to distinguish them.
Bullish Hammer
9000% similarA hammer is a specific type of long lower shadow candle with strict criteria. Any candle with a long lower shadow fits this broader pattern.
Key Differences
- Hammer has specific body position and size requirements
- Long lower shadow is a more general concept
A candle with a long upper shadow (at least 2-3x the body) indicates that price rallied significantly during the session but was rejected, closing near the low. It signals selling pressure and potential reversal at the top of rallies.
The Dragonfly Doji is a powerful single-candle reversal signal where sellers push price significantly lower during the session, but buyers fight back to close at the opening level, creating a T-shaped candle that signals complete rejection of lower prices.
The Bullish Engulfing is one of the most popular and reliable two-candle reversal patterns. A large bullish candle completely engulfs the prior bearish candle body, signaling a decisive shift from selling to buying control.
The Inverted Hammer is a single-candle bullish reversal pattern appearing at the bottom of downtrends. Its long upper shadow shows buyers attempted to push price higher, hinting that the selling pressure may be ending.
The Bullish Takuri is a single-candle reversal pattern characterized by an extremely long lower shadow and a tiny body near the candle's high. It is a stronger version of the hammer, indicating aggressive rejection of lower prices and a high probability of trend reversal.
The Bearish Belt Hold is a single bearish candle that opens at its high and closes near its low with a long body, indicating that sellers dominated from the opening bell and controlled price action throughout the session.
Pro Tips & Common Mistakes
Pro Tips
- The longer the shadow relative to the body, the stronger the buying rejection signal
- The tip of the shadow marks a specific support level — it's where institutional buyers stepped in
- A long lower shadow on heavy volume is significantly more reliable than one on low volume
- The pattern is universal — it works in any market, any timeframe, and any asset class
- Combine with at least one other confluence factor (support, MA, RSI) for best results
Common Mistakes
- Treating every long shadow as a buy signal without considering context
- Ignoring volume — the shadow needs buying volume to be meaningful
- Not waiting for confirmation in uncertain markets
- Placing stops at the body instead of below the shadow tip
- Using the signal in free-falling markets where long shadows repeatedly fail
Advanced Techniques
- Map shadow tips across multiple days to identify exact institutional support zones
- Use volume-at-price data to verify buying occurred at the shadow's low
- Compare shadow lengths to ATR to normalize the signal across different volatility regimes
- Build a shadow-length scanner to systematically identify the strongest rejection candles
Institutional Perspective
The long lower shadow directly reveals where institutional limit buy orders sit. Fund managers place large limit orders at key levels, and when price trades down to those orders, the shadow is created. The shadow length indicates the size of the buying interest.
Fun Facts
- The lower shadow is sometimes called a 'tail' — and just like a scorpion's tail, the longer it is, the more dangerous it can be for sellers.
- Japanese rice traders viewed the lower shadow as a literal measure of buying strength at a price level.
- Studies show that candles with shadows greater than 3x the body length have a significantly higher reversal rate than those with shorter shadows.
Frequently Asked Questions
A long lower shadow shows that sellers pushed price significantly lower during the session, but buyers aggressively pushed it back up. It indicates strong buying demand at lower prices.
The lower shadow should be at least 2-3 times the length of the real body to be considered significant. Longer shadows indicate stronger buying rejection.