Overview
Bullish ABC Bounce
Also known as: ABC Correction, Three-Wave Pullback, Zigzag Bounce
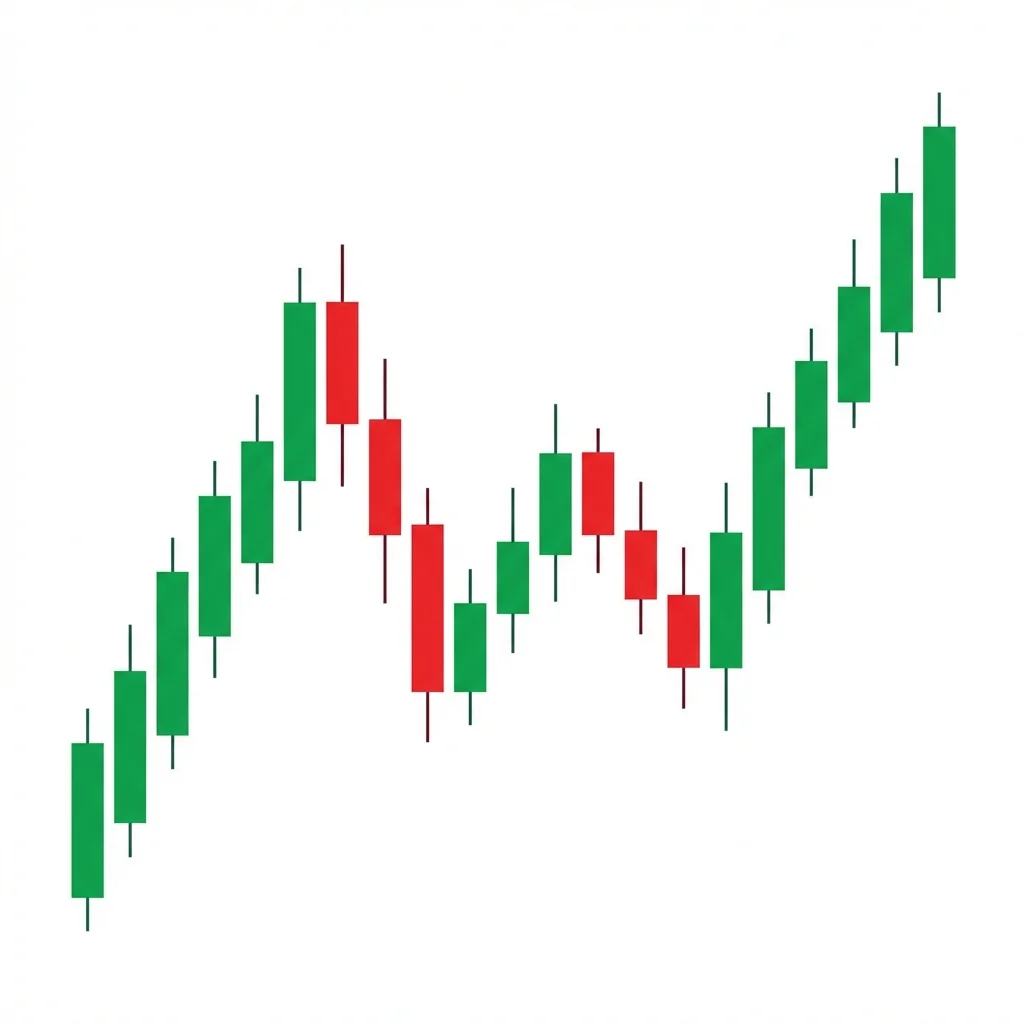
The Bullish ABC Bounce is a simple but powerful continuation pattern where price makes a three-wave corrective pullback within an uptrend before resuming higher. It is one of the most fundamental and frequently occurring patterns in all of technical analysis.
The ABC Bounce represents the market's natural rhythm of impulse and correction. After an upward move, price pulls back in a three-wave structure labeled A, B, and C. The A-leg is the initial decline from the high. The B-leg is a counter-trend bounce that doesn't reach the prior high. The C-leg is the final decline that ideally terminates near a Fibonacci support level. The bounce from point C signals the resumption of the primary uptrend. This pattern works because healthy trends don't move in straight lines — they progress through a series of impulses and corrections. The ABC correction allows overbought conditions to unwind and creates fresh entry points for trend followers.
History & Etymology
The ABC pattern is rooted in Elliott Wave Theory, developed by Ralph Nelson Elliott in the 1930s. Elliott observed that markets move in predictable wave patterns, with impulse waves subdividing into five waves and corrective waves into three (ABC). The simplified ABC bounce concept became a staple of trend-following methodologies used by traders like William O'Neil and Alexander Elder.
The letters A, B, and C simply label the three pivot points of the corrective wave. This straightforward naming convention comes from Elliott Wave analysis where corrective structures are labeled with letters (as opposed to impulse waves labeled with numbers).
How It Forms
Formation Steps
- 1A-leg: Price declines from a swing high (point A) to a swing low (point B)
- 2B-leg: Price bounces upward from B but fails to reach point A, forming point B-top (or C-start)
- 3C-leg: Price declines again from the B-top to form point C, which holds above or near point B
- 4Bounce: Price reverses upward from point C, resuming the larger uptrend
Prerequisites
- Established uptrend prior to the correction
- Point A is a clear swing high
- The pullback should be orderly, not panicked
Confirmation Signals
- Price bounces from point C with a strong bullish candle
- Volume increases on the bounce from C
- Point C holds above a key Fibonacci retracement (38.2%-61.8%)
- Higher low at point C relative to previous major swing low
Invalidation Signals
- Price breaks below point B significantly
- The correction becomes deeper than 78.6% retracement
- Volume expands on the C-leg decline rather than contracting
Candle Breakdown
A-Leg Start
The initial bearish candle(s) that begin the pullback from the swing high.
Profit-taking begins after the uptrend. Early sellers lock in gains.
B-Leg Bounce
A brief bullish recovery that fails to reach the prior high, forming the B pivot.
Dip buyers step in but lack conviction. The bounce is weak, signaling more correction needed.
C-Leg Completion
The final decline to point C, followed by a strong bullish reversal candle at the support zone.
Weak hands are shaken out at point C. Smart money accumulates at the pullback low, and the reversal candle signals the trend is resuming.
Psychology
The ABC Bounce reflects the natural psychological cycle within a trend: profit-taking creates the A-leg, value seekers create the B-leg bounce, final shakeout creates the C-leg, and trend resumption occurs as conviction returns.
Buyer Perspective
Patient buyers wait for the C-point pullback to enter at a discount. They see the higher low (C above previous major low) as confirmation the uptrend remains intact.
Seller Perspective
Sellers are primarily profit-takers, not new shorts. Their selling pressure diminishes through the correction as the easy profits have been booked.
Smart Money Action
Institutional traders often scale into positions throughout the C-leg, using the pullback to build positions at better prices. They know the trend is intact and use the correction as an opportunity.
Retail Trader Trap
Retail traders often sell in panic at point C (the exact worst time) or chase the initial B-leg bounce only to be stopped out during the C-leg decline.
Emotional Cycle
Trading Strategy
Aggressive Entry
Enter long as soon as point C shows a bullish reversal candle at a Fibonacci support level (38.2%-61.8% of the prior impulse).
Conservative Entry
Wait for price to break above the B-point high, confirming the correction is complete and the uptrend is resuming.
At the prior swing high (point A) — the most conservative target.
At a 127.2% Fibonacci extension of the A-C range projected from point C.
At a 161.8% Fibonacci extension for a full trend continuation target.
Best Conditions
- Timeframe: 4h
- Timeframe: daily
- Timeframe: weekly
- Strong trending markets
- Low-volatility pullbacks within high-volatility uptrends
- Bull markets with healthy sector breadth
- Asset: stocks
- Asset: ETFs
- Asset: forex
- Asset: crypto
Avoid When
- Timeframe: 1m
- Timeframe: 5m
- Choppy, trendless environments
- Bear markets where 'pullbacks' turn into new legs down
- High-correlation selloffs (everything drops together)
Confluence Factors
- Point C lands on a Fibonacci retracement level (38.2%, 50%, 61.8%)
- Point C lands on a rising moving average (20 or 50 EMA)
- RSI oversold or showing bullish divergence at point C
- Point C at a prior support/resistance flip zone
- Volume dries up at point C (sellers exhausted)
Scale In Strategy
Enter 50% at point C with reversal confirmation, add 50% on break above point B.
Scale Out Strategy
Sell 33% at point A (prior high), 33% at 127.2% extension, trail the remainder.
Risk Management
Volume Analysis
Volume Confirmation
Volume should decline during the A and C legs (selling drying up) and increase on the bounce from C (buyers returning).
Volume Profile
The volume profile should show a high-volume node at or near point C, indicating demand absorption.
Volume Divergence
If volume increases during the C-leg and the bounce is on low volume, the pattern is suspect.
Technical Confluence
Support Resistance
Point C is most powerful when it coincides with a horizontal support level, trendline, or previous resistance-turned-support.
Fibonacci Levels
The 50% and 61.8% retracements of the impulse move are the most common C-point termination levels. Shallow pullbacks to 38.2% are typical in strong trends.
Moving Averages
The 20 EMA or 50 SMA often acts as dynamic support at point C. The bounce from a moving average adds significant confluence.
Rsi Confirmation
RSI should pull back from overbought toward 40-50 during the correction and begin turning up at point C. Bullish divergence at C is ideal.
Macd Confirmation
MACD should show decreasing bearish momentum during the C-leg, with a potential bullish crossover at or near point C.
Bollinger Bands
Price pulling back to the middle or lower Bollinger Band at point C provides dynamic support and mean-reversion confluence.
Vwap
On intraday timeframes, point C bouncing off VWAP or the lower standard deviation band is a strong confirmation.
Ichimoku Cloud
Price pulling back to the Tenkan-sen or Kijun-sen (but staying above the cloud) at point C confirms the uptrend is intact.
Elliott Wave
The ABC bounce is literally the corrective wave structure in Elliott Wave Theory — Wave 2 or Wave 4 corrections.
Wyckoff Phase
In the markup phase, ABC corrections are normal 'backing up to the creek' events that offer re-entry opportunities.
Market Profile
Point C often forms at the point of control (POC) of a recent value area, where the most volume was traded.
Order Flow
Look for absorption at point C — large passive buy orders absorbing sell market orders, indicating institutional demand.
Open Interest
Stable or rising open interest during the correction confirms that the trend participants are not exiting, just that price is correcting.
Multi-Timeframe Analysis
Higher Timeframe Alignment
Confirm the uptrend on the weekly chart. The daily ABC correction should look like a minor blip on the weekly chart.
Lower Timeframe Entry
Drop to the 1-hour chart at point C to find a specific reversal candle or pattern (hammer, engulfing) for precise entry timing.
Timeframe Confluence
Ideal when the daily ABC correction terminates at a weekly support level or weekly moving average.
Top-Down Approach
Weekly confirms uptrend → Daily identifies ABC correction → 4-hour or 1-hour times the entry at point C.
Statistics
Historical Examples
Tesla ABC Pullback in 2020 Bull Run
successAfter its massive run-up and stock split, TSLA pulled back in a textbook ABC pattern. The C-point held at the 50% Fibonacci level near $330 (split-adjusted) before resuming its rally.
Lesson: Even in the most parabolic moves, ABC corrections provide structured entry points. The key is waiting for the C-point to hold above the 61.8% level.
EUR/USD ABC Correction
partialEUR/USD formed an ABC correction after a 300-pip rally. The C-point held at the 61.8% level, and the bounce produced a 150-pip move before stalling at the prior high.
Lesson: In forex, ABC bounces often reach the prior high but may not extend much beyond it. Partial profits at the prior high are wise in ranging currency pairs.
Variations
Shallow ABC (38.2% Retracement)
The C-point only reaches the 38.2% Fibonacci level, indicating a very strong underlying trend.
Deep ABC (61.8%-78.6% Retracement)
The C-point reaches deeper Fibonacci levels, testing the conviction of the uptrend.
Complex ABC (W-shaped correction)
The C-leg itself subdivides into a smaller ABC, creating a more complex but still valid correction.
Confusion Matrix
Patterns commonly confused with Bullish ABC Bounce and how to distinguish them.
Bullish Flag
7500% similarFlags tend to be tighter and more uniform, while ABC corrections have clearer A, B, C pivot points.
Key Differences
- Flags have a more channel-like structure with parallel lines
- ABC bounces have a distinct three-wave zigzag shape
Bullish Falling Wedge
5500% similarDraw trendlines — if they converge, it's a wedge. If the correction is a simple zigzag, it's an ABC bounce.
Key Differences
- Falling wedges have converging trendlines
- ABC bounces don't require converging lines
The Bullish Engulfing is one of the most popular and reliable two-candle reversal patterns. A large bullish candle completely engulfs the prior bearish candle body, signaling a decisive shift from selling to buying control.
The Falling Wedge is a bullish pattern with two converging downward-sloping trendlines. The narrowing range compresses energy that is released on an upside breakout, making it both a reversal pattern (after downtrends) and a continuation pattern (during uptrend corrections).
The Bullish Flag is the quintessential continuation pattern: a sharp rally (pole) followed by a brief, tight consolidation (flag) before the next leg up. It represents a healthy pause in a strong uptrend.
The Higher Lows pattern is the most fundamental bullish structure, showing that buyers are willing to step in at progressively higher prices, indicating strengthening demand and a healthy uptrend.
The Bullish Pennant is a continuation pattern featuring a sharp advance (flagpole) followed by a brief triangular consolidation (pennant), before price breaks out and continues higher with a measured move equal to the flagpole.
The Broadening Top (Megaphone) is a chart formation characterized by expanding price swings that create higher highs and lower lows, reflecting increasing volatility and instability at market tops before a bearish breakdown.
Pro Tips & Common Mistakes
Pro Tips
- The strongest ABC bounces occur when the C-point is a higher low relative to the start of the entire trend, not just the latest swing
- Use Fibonacci retracement from the impulse move to identify the ideal C-point zone before it forms
- Volume should tell the story: declining on the correction, expanding on the bounce
- Combine with trendline support — if a rising trendline intersects with the Fibonacci level at C, it is a high-conviction zone
- In strong trends, the C-point often terminates at the 38.2% level; reaching 61.8% suggests weakening momentum
Common Mistakes
- Buying the B-leg bounce too early, getting stopped out during the C-leg
- Confusing a trend reversal with an ABC correction — always check the higher timeframe trend
- Setting targets too high without considering resistance from point A
- Ignoring the broader market context — ABC corrections fail more often in bearish environments
- Not waiting for a bullish candle at point C before entering
Advanced Techniques
- Overlay the ABC with Elliott Wave counting to confirm you are in a Wave 2 or 4 correction
- Use the Stochastic oscillator in the 20-zone at point C for additional timing confirmation
- Measure the A-leg distance and project it from point C to estimate the minimum bounce target
- In stocks, cross-reference with options flow — bullish call buying at point C confirms institutional interest
Institutional Perspective
Institutions use ABC pullbacks as their primary trend-following entry method. Large funds cannot buy breakouts due to slippage, so they wait for corrections to scale into positions. The C-point is where institutional algorithms typically place limit buy orders.
Fun Facts
- The ABC pattern is the most traded pattern globally — virtually every trend-following strategy is some variation of buying the ABC pullback.
- Ralph Nelson Elliott discovered that even the ABC correction itself subdivides into smaller ABCs — it's fractal geometry at work in markets.
- William O'Neil's CANSLIM method is essentially about finding ABC bounce entries in stocks with strong fundamentals.
Frequently Asked Questions
The most common C-point levels are the 50% and 61.8% Fibonacci retracement of the prior impulse. In strong trends, the C-point may only reach 38.2%. A correction deeper than 78.6% suggests the trend may be reversing rather than just correcting.
Key differences: An ABC correction occurs within an intact higher timeframe uptrend, volume typically decreases during the correction, and the C-point holds above major support levels. A reversal will show increasing volume on the decline, break below major support, and the higher timeframe trend will shift bearish.
Yes, the inverse (bearish ABC) exists in downtrends as a short-selling opportunity. The same principles apply in reverse — rallies within a downtrend form ABC corrections that offer shorting entries.