Overview
Bullish Fair Value Gap
Also known as: FVG Long, Imbalance Zone, Inefficiency Gap, ICT Fair Value Gap
The Bullish Fair Value Gap (FVG) is a smart money concept identifying price imbalances where aggressive buying creates a gap between the first candle high and third candle low. Price often returns to this zone to fill the inefficiency before continuing higher.
A Fair Value Gap forms when aggressive buying creates a price displacement so rapid that not all orders are filled at every price level, leaving an imbalance or inefficiency in the market. The FVG zone is defined as the area between the high of the first candle and the low of the third candle in a three-candle sequence where the second candle is a large impulsive move. Smart money traders expect price to return to this zone to fill the imbalance, at which point they enter long positions. The concept comes from ICT (Inner Circle Trader) methodology and has become one of the most popular smart money trading concepts. The FVG acts as a magnet for price and then as a support zone when price returns to it.
History & Etymology
The Fair Value Gap concept was popularized by Michael J. Huddleston (ICT) as part of his smart money trading methodology. While the concept of price imbalances and gap-filling is not new, ICT formalized the three-candle FVG structure and its use as an institutional entry zone. The concept gained massive popularity in the 2020s among retail traders.
Fair Value refers to the price level where buying and selling are in equilibrium. A Fair Value Gap represents a zone where price moved so quickly that fair value was not established, creating an inefficiency that the market tends to revisit and fill.
How It Forms
Formation Steps
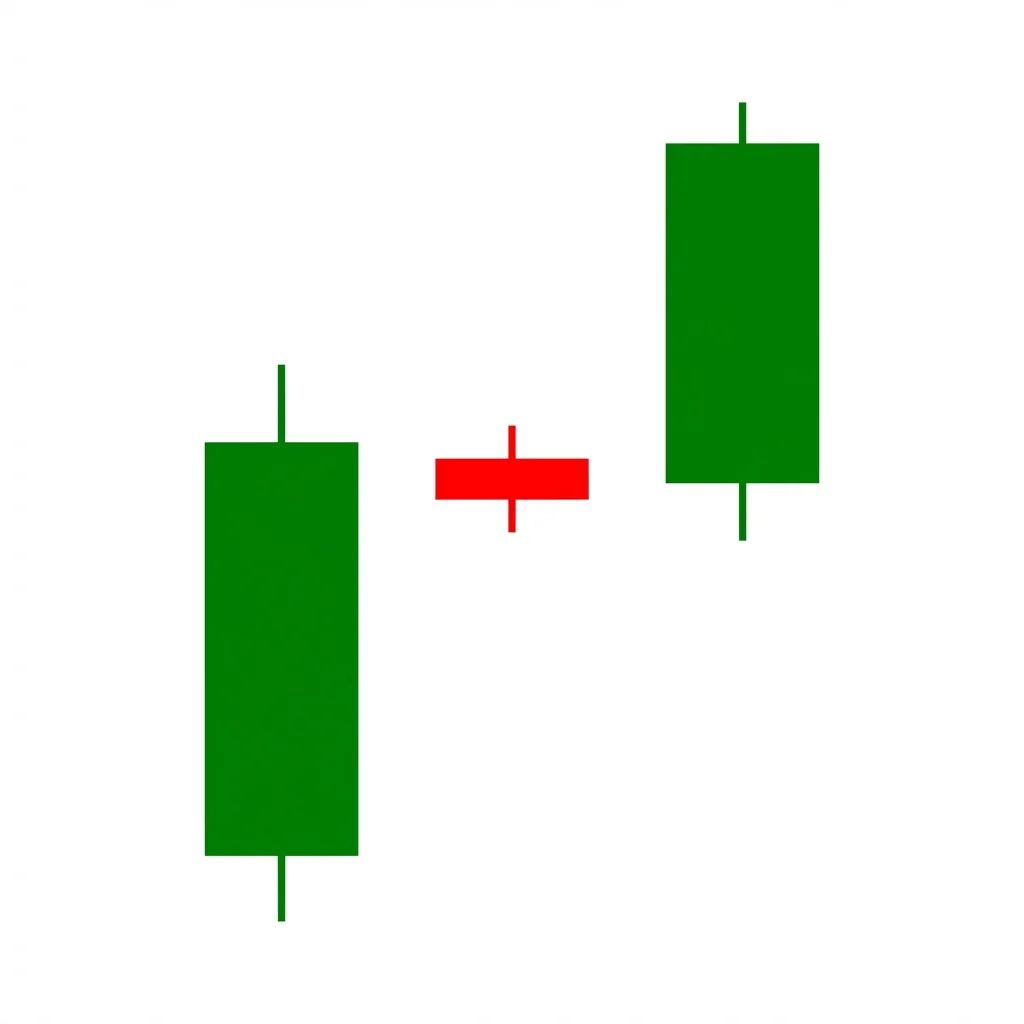
- 1First candle: any candle that establishes a high
- 2Second candle: a large bullish candle that creates a gap between the first candle high and the third candle low
- 3Third candle: any candle whose low is above the first candle high, creating the visible gap (FVG zone)
Prerequisites
- Strong bullish momentum creating displacement
- The gap zone (between first candle high and third candle low) must be visible
- Ideally forms during an impulsive move in the direction of the trend
Confirmation Signals
- Price returns to fill the FVG zone and bounces (entry zone)
- The FVG zone holds as support on retest
- Volume increases on the bounce from the FVG zone
Invalidation Signals
- Price trades through and closes below the entire FVG zone
- The FVG zone is violated with strong momentum
- No retest occurs and the gap remains unfilled
Candle Breakdown
Pre-Gap Candle
Any candle that establishes the lower boundary of the FVG (its high).
Normal price action establishing the reference point for the gap zone.
Displacement Candle
A large bullish candle creating the impulse move that generates the imbalance.
Institutional order flow creates such aggressive buying that price leaps through levels without all orders being filled. This is displacement.
Post-Gap Candle
Any candle whose low is above the first candle high, confirming the FVG zone.
Price has moved beyond the gap zone. The space between the first candle high and this candle low is the FVG.
Psychology
Fair Value Gaps represent institutional urgency. When smart money needs to move price quickly, they create displacement that leaves unfilled orders. The market has a tendency to return to these zones to fill the inefficiency before continuing in the direction of the original impulse.
Buyer Perspective
Smart money buyers who created the displacement expect price to return to the FVG for additional entries. They place limit orders within the zone.
Seller Perspective
Sellers see the pullback to the FVG as a potential shorting opportunity, but the institutional buy orders waiting in the zone overpower their selling.
Smart Money Action
Institutions create FVGs during impulsive moves when they need to fill large orders quickly. They then place unfilled portions of their orders as limit buys within the FVG zone, creating a support shelf.
Retail Trader Trap
Retail traders who short the pullback into the FVG are trapped when institutional bids absorb their selling and price bounces.
Emotional Cycle
Trading Strategy
Aggressive Entry
Enter long immediately when price enters the FVG zone (between first candle high and third candle low).
Conservative Entry
Wait for a bullish reversal candle within the FVG zone before entering.
At the high of the displacement candle (second candle).
At the high of the swing that created the displacement.
At the next liquidity target (previous high or equal highs).
Best Conditions
- Timeframe: 5m
- Timeframe: 15m
- Timeframe: 1h
- Timeframe: 4h
- Timeframe: daily
- Trending markets
- After market structure breaks
- During high-volume sessions
- Asset: forex
- Asset: futures
- Asset: crypto
- Asset: stocks
Avoid When
- Timeframe: 1m
- Choppy, ranging markets
- Low-liquidity environments
Confluence Factors
- FVG aligns with an order block
- FVG at a Fibonacci retracement (50-79%)
- FVG at a previous support level
- Multiple timeframe FVG alignment
- FVG in the premium/discount zone
Scale In Strategy
Enter 50% at the top of the FVG, 50% at the bottom of the FVG if price goes deeper.
Scale Out Strategy
Take 50% at the displacement high, trail the rest to the next liquidity target.
Risk Management
Volume Analysis
Volume Confirmation
The displacement candle should have above-average volume. Volume on the retest should be lower (showing weaker selling).
Volume Profile
Low volume during the pullback to the FVG confirms that sellers are not aggressive.
Volume Divergence
High volume driving through the FVG zone suggests it may not hold.
Technical Confluence
Support Resistance
The FVG zone itself acts as a dynamic support zone. It combines the concept of support with order flow theory.
Fibonacci Levels
FVGs that align with the 50-79% Fibonacci retracement of the impulse move are called optimal trade entries (OTE) in ICT methodology.
Moving Averages
FVGs near the 20 or 50 EMA add traditional technical confluence.
Rsi Confirmation
RSI pulling back toward 50 during the FVG retest shows momentum cooling without turning bearish.
Macd Confirmation
MACD remaining positive during the pullback to the FVG confirms the bullish trend is intact.
Bollinger Bands
The displacement candle often pushes beyond the upper band, and the FVG retest returns to the middle band.
Vwap
FVG zones near VWAP provide additional smart money confluence.
Ichimoku Cloud
Limited traditional use, but FVG above the cloud confirms bullish context.
Elliott Wave
FVGs often form during Wave 3 impulses, with the retest being the Wave 4 correction.
Wyckoff Phase
FVGs form during the markup phase when institutional buying creates rapid displacement.
Market Profile
The FVG corresponds to a single-print zone in market profile, where price moved through without establishing significant volume.
Order Flow
The FVG zone often coincides with areas of strong positive delta imbalance during the original move.
Open Interest
New positions established during the displacement are defended when price revisits the FVG.
Multi-Timeframe Analysis
Higher Timeframe Alignment
A daily FVG provides the zone, and a 1-hour or 15-minute chart provides the entry trigger within the zone.
Lower Timeframe Entry
Drop to the 5-minute or 15-minute chart to find a precise entry signal when price enters the higher timeframe FVG.
Timeframe Confluence
When a weekly FVG, daily FVG, and 4-hour FVG all align at the same price zone, it creates a high-probability setup.
Top-Down Approach
Weekly identifies the macro FVG zone, daily narrows the range, 1-hour or 15-minute provides the entry signal.
Statistics
Historical Examples
EUR/USD FVG Retest and Rally
successEUR/USD created a bullish FVG during a strong impulsive rally. Price retraced into the FVG zone within 8 hours and bounced precisely from the midpoint of the gap, continuing to new highs.
Lesson: FVG retests in forex during active sessions provide precise entries with tight stops. The midpoint of the FVG often acts as the specific price level where orders fill.
Variations
Inverted FVG (IFVG)
A bearish FVG that gets reclaimed and becomes bullish support.
Micro FVG
A very small FVG on a lower timeframe.
Confusion Matrix
Patterns commonly confused with Bullish Fair Value Gap and how to distinguish them.
Bullish Order Block
6000% similarAn order block is the last bearish candle before a bullish move. An FVG is the gap between the first and third candle in a three-candle displacement sequence. They often overlap but are different concepts.
Key Differences
- Order blocks are specific candles before displacement
- FVGs are the gap zones created by displacement
Bullish Rising Window
5500% similarRising windows are simpler two-candle gaps. FVGs specifically measure the zone between the first candle high and third candle low in a three-candle sequence.
Key Differences
- Rising windows are traditional gap-up patterns between two candles
- FVGs are three-candle imbalance zones used in smart money methodology
The Gap and Go occurs when price gaps up on a catalyst, and instead of filling the gap, continues higher as momentum buying drives the stock to new levels throughout the session.
A Bullish Market Structure Break (MSB/BOS) occurs when price in a downtrend breaks above the most recent swing high, signaling that the series of lower highs has ended and a potential trend reversal is underway.
A Bullish Order Block is the last bearish candle before a strong upside displacement. It marks where institutional buying occurred, and when price returns to this zone, it often bounces as institutions defend their entry level.
The Bullish Rising Window is a gap-up pattern where the second candle's low is entirely above the first candle's high, creating a visible window (gap) that acts as future support and signals trend continuation.
A bearish market structure break occurs when price in an uptrend breaks below a prior swing low, invalidating the series of higher highs and higher lows that defined the uptrend. It signals a potential trend reversal from bullish to bearish.
A bearish order block is the last bullish candle before a significant bearish displacement, representing an area where institutional sellers placed large sell orders. When price returns to this zone, it often reverses downward as unfilled orders are executed.
Pro Tips & Common Mistakes
Pro Tips
- Not all FVGs are created equal. Focus on FVGs created by strong displacement candles with above-average volume
- FVGs in higher timeframes are more significant than lower timeframe FVGs
- When a higher timeframe FVG aligns with a lower timeframe FVG, the confluence is very powerful
- The midpoint of the FVG (consequent encroachment) is often where price bounces most precisely
- FVGs that are not filled within 5-10 candles may lose significance as the market moves on
Common Mistakes
- Trading every FVG without considering the trend direction and market context
- Not waiting for price to actually reach the FVG before entering
- Placing stops too tight within the FVG instead of below it
- Ignoring that FVGs can be fully filled (price passes through) without providing support
Advanced Techniques
- Use FVG stacking (multiple FVGs at the same level from different timeframes) for high-confluence entries
- Combine FVGs with order blocks and liquidity pools for complete ICT methodology entries
- Use the consequent encroachment (50% of the FVG) as the primary entry level
- Monitor how much of the FVG is filled on the retest to gauge the strength of support
Institutional Perspective
Fair Value Gaps represent institutional order flow in its purest form. When large funds execute aggressive orders, they create these imbalances. The retest of the FVG is where they fill the remaining portions of their orders, which is why the zone acts as support.
Fun Facts
- The Fair Value Gap concept has become so popular that it is now one of the most discussed trading concepts on social media, despite being relatively unknown before 2020.
- ICT claims that institutions intentionally create FVGs to mark price levels where they plan to add to their positions on the retest.
- The FVG concept has been adapted to algorithmic trading, with quant firms incorporating FVG detection into their order flow models.
Frequently Asked Questions
Studies suggest that approximately 60-70% of FVGs eventually get retested or filled. However, in very strong trends, some FVGs may never be revisited as price continues aggressively in the trend direction. FVGs that are not retested within 5-10 candles become less significant.
A regular gap is the space between one candle close and the next candle open. A Fair Value Gap specifically measures the zone between the first candle HIGH and the third candle LOW in a three-candle sequence. FVGs can exist even when there is no traditional gap between candle closes and opens.