Overview
Bullish Harami
Harami (孕み)
Also known as: Inside Bar Bullish, Pregnant Pattern
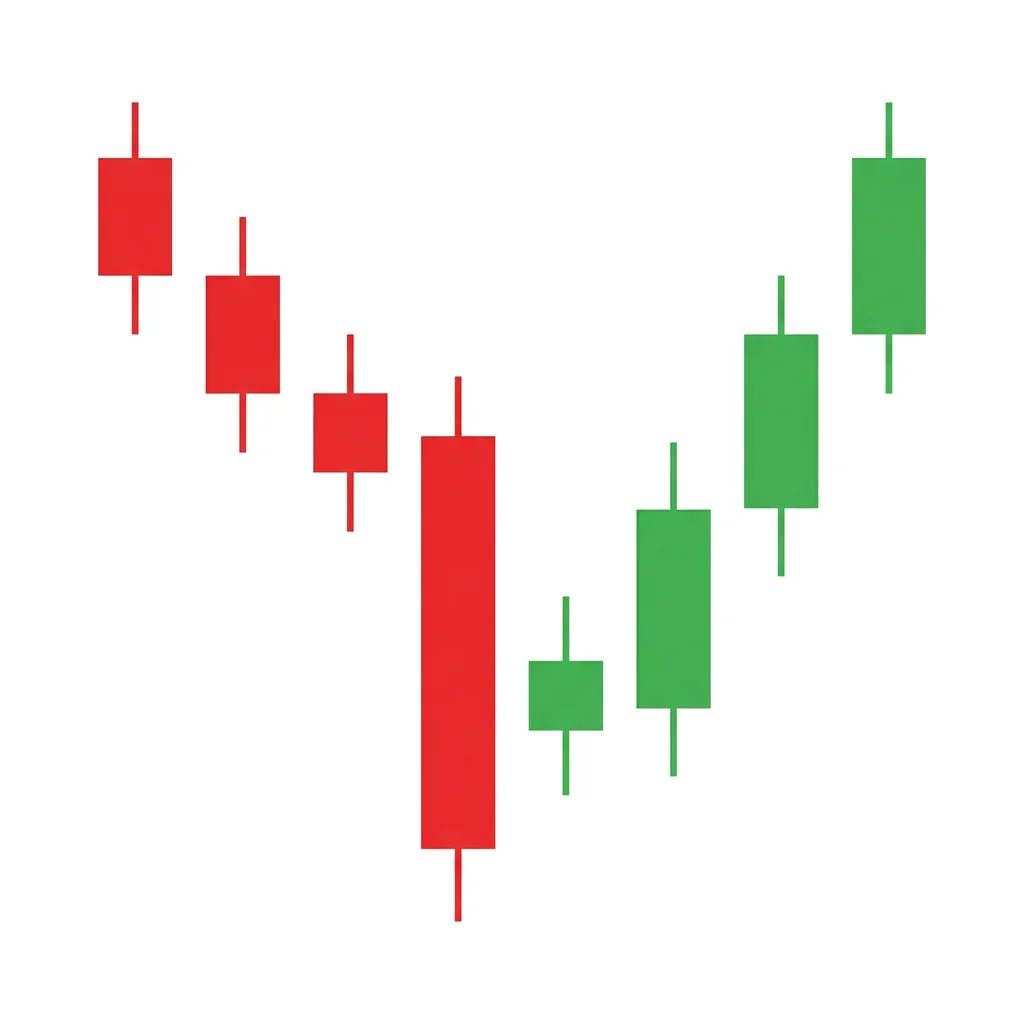
The Bullish Harami is a two-candle reversal pattern where a small bullish candle is entirely contained within the body of the preceding large bearish candle, signaling a potential end to a downtrend.
The Bullish Harami forms when selling pressure exhausts itself in a large bearish candle, followed by a small bullish candle that trades within the prior candle's body range. The word 'harami' means 'pregnant' in Japanese, as the second candle appears to be contained within the first, like a child within a mother. This contraction in range signals that bears are losing control and a reversal may be imminent. The pattern is moderate in reliability and typically requires confirmation from the next candle or supporting indicators.
History & Etymology
The Bullish Harami originates from Japanese candlestick charting, developed by rice traders in 18th-century Japan. It was popularized in Western markets by Steve Nison in the early 1990s through his book 'Japanese Candlestick Charting Techniques'. The pattern is one of the most widely recognized reversal signals in candlestick analysis.
The name 'harami' comes from the Japanese word meaning 'pregnant' or 'body within a body', describing how the second candle's body is contained within the first candle's body, resembling a pregnant woman in profile.
How It Forms
Formation Steps
- 1First candle: large bearish candle with a wide real body
- 2Second candle: small bullish candle whose body fits entirely within the first candle's body
Prerequisites
- Established downtrend of at least several bars
- First candle must have a large real body
- Second candle body must be completely contained within first candle body
Confirmation Signals
- Third candle closes above the high of the second candle
- Increased volume on the confirmation candle
- RSI divergence at the pattern location
Invalidation Signals
- Price closes below the low of the first candle
- Third candle is a strong bearish candle
- Volume remains heavy on downside
Candle Breakdown
Mother Candle
A large bearish candle that represents the continuation of the existing downtrend with strong selling pressure
Bears appear fully in control, pushing price sharply lower. This creates confidence among sellers.
Baby Candle
A small bullish candle that opens and closes within the body of the first candle, showing the downtrend is losing momentum
Selling pressure evaporates and buyers tentatively step in. The small range signals indecision and a potential shift in control.
Psychology
The Bullish Harami reflects a sudden contraction in volatility and selling pressure after a strong bearish move. The small second candle indicates that bears have exhausted their momentum, creating space for buyers to regain control.
Buyer Perspective
Buyers see the small body within the prior large bearish candle as a sign that selling pressure is waning. They begin to accumulate positions cautiously, waiting for confirmation before committing fully.
Seller Perspective
Sellers who drove the first candle lower become uncertain when the second candle fails to continue the move. Some begin taking profits, reducing the downward pressure.
Smart Money Action
Institutional traders often use the harami as a signal to begin quietly accumulating positions, especially when the pattern forms at key support levels or after an extended decline.
Retail Trader Trap
Retail traders may short the first candle aggressively, only to be trapped when the second candle signals the momentum shift. Those who panic-sold at the bottom may buy back at higher prices.
Emotional Cycle
Trading Strategy
Aggressive Entry
Enter long at the close of the second (small bullish) candle, placing the stop below the low of the first candle.
Conservative Entry
Wait for a third candle to close above the high of the second candle before entering long.
Previous swing high or 1:1 risk-reward ratio.
2:1 risk-reward ratio or the next resistance level.
Measured move equal to the height of the first candle projected upward from the breakout.
Best Conditions
- Timeframe: daily
- Timeframe: 4h
- Timeframe: weekly
- oversold conditions
- at support levels
- after extended downtrend
- Asset: stocks
- Asset: forex
- Asset: ETFs
Avoid When
- Timeframe: 1m
- Timeframe: 5m
- strong downtrend with high momentum
- during panic selling
- low liquidity environments
Confluence Factors
- Pattern forms at a key support level
- RSI shows bullish divergence
- Pattern appears near a moving average (50 or 200 day)
- Fibonacci retracement level alignment
- Oversold stochastic reading
Scale In Strategy
Add to the position on a successful retest of the breakout level or at the first higher low after entry.
Scale Out Strategy
Take one-third off at TP1, another third at TP2, and let the final third run with a trailing stop.
Risk Management
Volume Analysis
Volume Confirmation
Volume should decrease on the second candle and increase on the confirmation candle for best results.
Volume Profile
High volume on the first candle, declining volume on the second candle indicates selling exhaustion.
Volume Divergence
Declining volume during the overall downtrend leading to the pattern increases the probability of reversal.
Technical Confluence
Support Resistance
Most effective when forming at established support levels, prior swing lows, or demand zones.
Fibonacci Levels
High probability when aligning with the 38.2%, 50%, or 61.8% Fibonacci retracement levels.
Moving Averages
Look for the pattern near the 50-day or 200-day moving average for added confluence.
Rsi Confirmation
Bullish divergence on RSI (price makes lower low while RSI makes higher low) significantly increases reliability.
Macd Confirmation
A MACD bullish crossover or histogram turning positive near the pattern adds conviction.
Bollinger Bands
Pattern forming at or below the lower Bollinger Band suggests price is oversold and a bounce is likely.
Vwap
Intraday traders should look for the pattern below VWAP with a subsequent reclaim as confirmation.
Ichimoku Cloud
Pattern below the Kumo cloud with a bullish Tenkan-Kijun crossover adds confluence.
Elliott Wave
The harami often appears at the end of Wave 5 or Wave C, marking a corrective low.
Wyckoff Phase
Commonly appears during the spring phase of a Wyckoff accumulation schematic.
Market Profile
Look for the pattern at the Point of Control or Value Area Low for high-probability trades.
Order Flow
Decreasing aggressive sell orders and emerging buy imbalances on the second candle confirm the signal.
Open Interest
In futures, declining open interest on the second candle supports the exhaustion thesis.
Multi-Timeframe Analysis
Higher Timeframe Alignment
Confirm that the weekly trend is either bullish or showing signs of exhaustion before trading a daily harami.
Lower Timeframe Entry
Use the 1-hour chart to find a precise entry after the daily harami forms, such as a break of a short-term downtrend line.
Timeframe Confluence
A harami on the daily chart that appears at a weekly support level offers the strongest setup.
Top-Down Approach
Start with the weekly chart to identify support zones, then look for the harami on the daily chart, and use the 4-hour chart for entry timing.
Statistics
Historical Examples
Apple (AAPL) Reversal at Support
successAAPL formed a bullish harami at the COVID-19 bottom near $56. The pattern preceded a massive rally back above $80 within weeks.
Lesson: Bullish harami patterns at major support levels during extreme fear can produce outsized returns.
EUR/USD Consolidation Signal
partialEUR/USD formed a bullish harami near 1.1660 support. Price rallied to 1.1720 before resuming the downtrend.
Lesson: In strong downtrends, harami patterns may only produce short-term bounces rather than full reversals.
Tesla Failed Harami
failureTSLA formed a bullish harami during a persistent downtrend. Price broke below the pattern low the next day and continued declining.
Lesson: Always wait for confirmation. The harami alone has a high failure rate without supporting signals.
Variations
Bullish Harami Cross
The second candle is a doji instead of a small bullish candle, indicating even stronger indecision.
Three Inside Up
A harami followed by a third bullish candle that closes above the first candle's open, providing built-in confirmation.
Confusion Matrix
Patterns commonly confused with Bullish Harami and how to distinguish them.
Bullish Harami Cross
9000% similarCheck if the second candle's open and close are nearly identical (doji). If so, it's a Harami Cross.
Key Differences
- Harami Cross has a doji as the second candle instead of a small bullish body
- Harami Cross is considered slightly more reliable
Bullish Engulfing
5000% similarIn a harami, the second candle is smaller. In an engulfing, the second candle is larger.
Key Differences
- Engulfing has the second candle's body completely engulfing the first
- Engulfing is the mirror image — the big candle comes second
The bearish harami is a two-candle reversal pattern where a large bullish candle is followed by a small bearish candle entirely contained within the first candle's body. It signals waning buying momentum and potential trend reversal.
The Bullish Doji Star is a two-candle pattern where a doji gaps below a bearish candle, signaling that selling momentum has stalled and a potential reversal is forming.
The Bullish Engulfing is one of the most popular and reliable two-candle reversal patterns. A large bullish candle completely engulfs the prior bearish candle body, signaling a decisive shift from selling to buying control.
The Bullish Harami Cross is a two-candle reversal pattern where a doji forms within the body of a preceding large bearish candle, indicating strong indecision and a potential bottom.
The Confirmed Shooting Star adds a bearish confirmation candle to the classic shooting star, eliminating the ambiguity of the standalone pattern and creating a higher-probability reversal signal at the top of uptrends.
The Bearish Counterattack Line features a bullish candle followed by a bearish candle that gaps up at the open but closes back to the same level as the first candle's close, signaling that sellers 'counterattacked' the bullish advance.
Pro Tips & Common Mistakes
Pro Tips
- Always wait for the third candle confirmation before entering — the harami alone is not a strong signal
- The smaller the second candle relative to the first, the stronger the indecision signal
- Combine with RSI divergence for significantly higher win rates
- Works best at established support levels rather than in the middle of a range
- Check multiple timeframes — a harami on the daily that aligns with weekly support is more powerful
Common Mistakes
- Entering before the confirmation candle closes above the second candle's high
- Ignoring the overall trend context — a harami in a strong downtrend often fails
- Placing stops too tight below the second candle instead of below the first candle's low
- Treating every harami as a high-probability setup without considering confluence factors
- Confusing a harami with a simple inside bar when the colors don't match the pattern definition
Advanced Techniques
- Use volume profile to confirm that the pattern forms in a high-volume node (accumulation zone)
- Apply the Three Inside Up pattern as a stronger version by waiting for a third confirming candle
- Combine with order flow analysis to verify that aggressive buyers are stepping in
- Use options: buy calls at the harami with a strike near the first candle's open for leveraged upside
Institutional Perspective
Institutions view the harami as a preliminary signal of momentum exhaustion. They often use it as a trigger to begin scaling into positions over multiple sessions rather than taking a single entry, especially when the pattern aligns with their fundamental thesis.
Fun Facts
- The word 'harami' literally means 'pregnant' in Japanese, describing the visual of one candle carrying another inside it.
- The Bullish Harami is one of the most frequently occurring reversal patterns, appearing in approximately 8% of all candlestick charts.
- Steve Nison's 1991 book introduced the harami to Western traders, making it one of the first Japanese patterns to gain mainstream adoption.
Frequently Asked Questions
A Bullish Harami is a two-candle reversal pattern where a small bullish candle is entirely contained within the body of a preceding large bearish candle, signaling potential end of a downtrend.
The Bullish Harami has moderate reliability with a win rate around 53%. It works best when combined with supporting indicators like RSI divergence and key support levels.
In a Bullish Harami, the second candle is smaller and contained within the first. In a Bullish Engulfing, the second candle is larger and completely engulfs the first. The Engulfing is generally considered more reliable.