Overview
Bullish High Tight Flag
Also known as: HTF, Power Flag, Momentum Flag
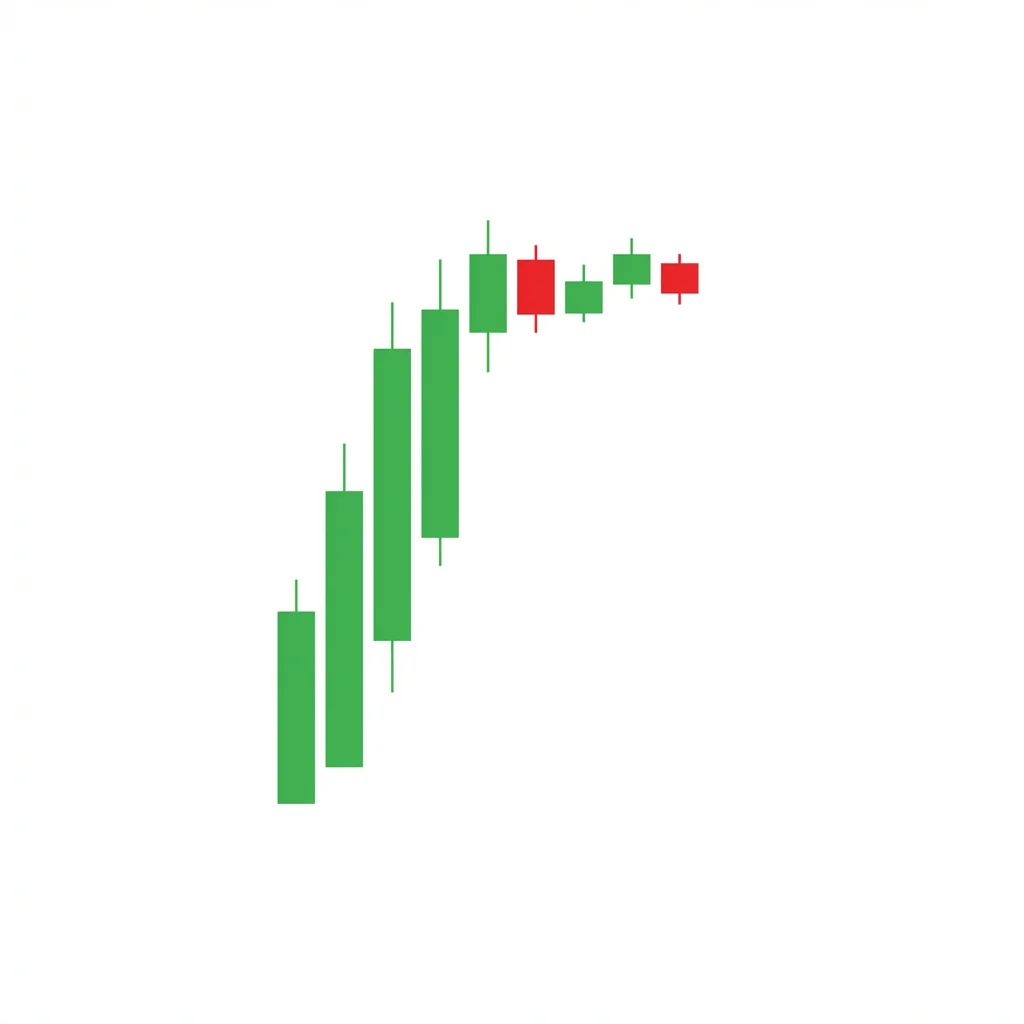
The High Tight Flag is one of the rarest and most powerful bullish continuation patterns. It features a stock that doubles in price quickly, then consolidates in a very tight range before breaking out to potentially double again.
The High Tight Flag (HTF) was popularized by William O'Neil and is considered one of the most bullish chart patterns in existence. It occurs when a stock surges 100% or more within approximately 4-8 weeks (the flagpole), then consolidates in a very tight range, pulling back only 10-25% from the high (the flag). This tight consolidation despite such a massive run-up indicates extreme underlying strength — holders are not willing to sell, and demand remains intense. When the flag breaks out, the move often mirrors or exceeds the initial advance.
History & Etymology
William O'Neil identified the High Tight Flag through his extensive research on the greatest stock winners. It appeared in many of the top-performing stocks before their biggest advances. O'Neil documented it in his book 'How to Make Money in Stocks' as one of the most reliable continuation setups.
The name describes its key characteristics: 'High' refers to the large percentage gain in the flagpole, 'Tight' describes the shallow consolidation range, and 'Flag' describes the rectangular or slightly downward-sloping consolidation shape.
How It Forms
Formation Steps
- 1Flagpole: a rapid price advance of 90-100% or more in 4-8 weeks
- 2Flag: a tight consolidation that retraces only 10-25% of the advance
- 3Breakout: price resumes the uptrend on expanding volume
Prerequisites
- Prior advance of at least 90-100% in approximately two months or less
- Consolidation must be tight, with no more than 10-25% pullback from the high
- The flag portion should last 3-5 weeks typically
Confirmation Signals
- Price breaks above the flag's resistance on heavy volume
- Volume surges 50%+ above average on the breakout day
- Gap up out of the flag formation
Invalidation Signals
- Pullback exceeds 25% from the high
- Flag consolidation lasts more than 8 weeks
- Volume dries up completely with no breakout attempt
Candle Breakdown
Flagpole Base
The beginning of the rapid advance that forms the flagpole, typically starting from a breakout
Strong institutional buying begins. The stock is being accumulated aggressively.
Flag Consolidation
Tight, controlled pullback after the massive advance, showing minimal selling pressure
Holders refuse to sell despite the massive run-up. This conviction is extremely bullish.
Psychology
The High Tight Flag reflects a stock with exceptionally strong institutional sponsorship. The tight consolidation after a doubling shows that smart money is holding firm and weak hands are not present — everyone holding is a believer.
Buyer Perspective
Buyers who drove the initial 100%+ advance are not selling. New buyers see the tight consolidation as proof of conviction and want in. The breakout triggers aggressive buying.
Seller Perspective
Sellers are virtually absent during the flag phase. Those who might sell have already been shaken out during the advance. The few remaining sellers cannot push price down more than 20-25%.
Smart Money Action
Institutional investors who drove the initial advance are holding and quietly adding during the flag. The tight range proves they are not distributing. They resume aggressive buying on the breakout.
Retail Trader Trap
Retail traders who missed the first move short the stock thinking it's 'too extended.' The breakout from the flag crushes these shorts, adding fuel to the rally.
Emotional Cycle
Trading Strategy
Aggressive Entry
Buy as price approaches the upper resistance of the flag with a tightening range.
Conservative Entry
Buy on the breakout above the flag's high with volume confirmation (50%+ above average).
Measured move: project the flagpole height from the breakout point.
150% of the flagpole height projected from breakout.
200% of flagpole height or a climactic volume signal.
Best Conditions
- Timeframe: daily
- Timeframe: weekly
- bull market
- leading sector
- new product cycle
- Asset: growth stocks
- Asset: tech stocks
- Asset: IPOs
Avoid When
- Timeframe: 1m
- Timeframe: 5m
- Timeframe: 15m
- bear market
- risk-off environment
- rising interest rates
Confluence Factors
- Strong earnings growth or positive catalyst
- Relative strength ranking in top 5% of market
- Industry group in top 20%
- Institutional accumulation visible in holdings data
- New all-time high breakout
Scale In Strategy
Enter 50% on the breakout, add 25% on a successful retest of the flag top, add final 25% on the first higher low after breakout.
Scale Out Strategy
Hold full position with a trailing stop. The biggest gains come from sitting tight.
Risk Management
Volume Analysis
Volume Confirmation
Volume must dry up during the flag and surge on the breakout. This is non-negotiable.
Volume Profile
Flagpole shows massive volume. Flag shows declining volume. Breakout must show volume surge.
Volume Divergence
Heavy volume during the flag suggests distribution, not consolidation — avoid.
Technical Confluence
Support Resistance
The flag's low is critical support. The flag's high is the breakout trigger. Prior round numbers matter.
Fibonacci Levels
The flag should retrace no more than 25% of the flagpole. Flags at the 10-15% retracement are strongest.
Moving Averages
The 10-day and 21-day EMA should support the flag. The stock should be well above the 50-day MA.
Rsi Confirmation
RSI should stay above 50 during the flag. A reset from overbought to 50-60 is ideal.
Macd Confirmation
MACD may pull back during the flag but should remain positive. A new bullish cross triggers the breakout.
Bollinger Bands
Bands compress during the flag (Bollinger squeeze), signaling a volatility expansion is imminent.
Vwap
Price should hold above VWAP during the flag phase on the daily timeframe.
Ichimoku Cloud
Price stays well above the cloud throughout the pattern. The cloud should be wide and green.
Elliott Wave
The flagpole is typically Wave 3 (the strongest wave), and the flag is a Wave 4 correction.
Wyckoff Phase
The pattern represents a brief re-accumulation within a larger markup phase.
Market Profile
The flag forms a balance area at elevated prices. Breakout from this balance triggers a new initiative move.
Order Flow
Aggressive buy orders resume on the breakout. Delta turns sharply positive.
Open Interest
Rising open interest on the breakout confirms new money entering, not just short-covering.
Multi-Timeframe Analysis
Higher Timeframe Alignment
The weekly chart should show the stock in a clear Stage 2 uptrend (above rising 30-week MA).
Lower Timeframe Entry
Use the daily chart breakout for entry. Intraday charts can provide exact timing within the breakout day.
Timeframe Confluence
Weekly shows the flagpole, daily shows the flag details, 4H provides entry precision.
Top-Down Approach
Identify on weekly, confirm on daily, enter on the breakout candle.
Statistics
Historical Examples
Monster Beverage Classic HTF
successMonster Beverage doubled from $10 to $20, then consolidated tightly for 4 weeks pulling back only 15%. The breakout led to another 100%+ advance.
Lesson: The HTF pattern often appears in consumer-growth stocks with accelerating earnings.
NVIDIA AI Surge HTF
successNVIDIA surged over 100% from its 2023 lows on AI demand, then consolidated in a tight flag near highs. The breakout produced another massive advance.
Lesson: HTF patterns in market leaders with secular growth themes can produce enormous moves.
Variations
Extreme High Tight Flag
A 200%+ advance with less than 15% pullback.
Multi-Stage HTF
Multiple consecutive HTF patterns as the stock advances in stages.
Confusion Matrix
Patterns commonly confused with Bullish High Tight Flag and how to distinguish them.
Bullish Flag
7500% similarMeasure the prior advance percentage and the depth of the pullback. If 100%+ advance with <25% pullback, it's an HTF.
Key Differences
- High Tight Flag requires a 100%+ advance; regular flag does not
- High Tight Flag pullback must be 10-25%; regular flags can pull back more
Bullish Pennant
6000% similarCheck the shape of the consolidation and the magnitude of the prior advance.
Key Differences
- Pennant has converging trendlines; HTF has parallel or rectangular boundaries
- Pennant doesn't require a specific advance percentage
The Bullish Ascending Triangle is a continuation pattern featuring flat resistance and rising support. Buyers are consistently willing to pay higher prices, compressing the range until a breakout above resistance triggers the next leg up.
The Bullish Flag is the quintessential continuation pattern: a sharp rally (pole) followed by a brief, tight consolidation (flag) before the next leg up. It represents a healthy pause in a strong uptrend.
The Bullish Pennant is a continuation pattern featuring a sharp advance (flagpole) followed by a brief triangular consolidation (pennant), before price breaks out and continues higher with a measured move equal to the flagpole.
The Broadening Top (Megaphone) is a chart formation characterized by expanding price swings that create higher highs and lower lows, reflecting increasing volatility and instability at market tops before a bearish breakdown.
The Descending Channel is a chart formation where price trends lower within two parallel downward-sloping trendlines, making consistent lower highs and lower lows in an orderly bearish progression.
The Descending Triangle is a bearish continuation pattern featuring a flat support level with lower highs converging into an apex, typically resolving with a breakdown below the horizontal support as sellers gradually overwhelm buyers.
Pro Tips & Common Mistakes
Pro Tips
- The tighter the flag (smaller percentage pullback), the more powerful the breakout
- Volume contraction during the flag is essential — it confirms that holders are not selling
- This pattern appears primarily in growth stocks with strong earnings acceleration
- Don't try to find this pattern in every stock — it's rare by design, appearing maybe 1-2 times per year in leading stocks
- The best HTFs have a fundamental catalyst driving the flagpole (earnings beat, new product, etc.)
Common Mistakes
- Calling any flag after a rally an HTF — the 100% advance requirement is strict
- Accepting pullbacks greater than 25% — deeper pullbacks indicate weaker conviction
- Ignoring volume — the flag MUST show declining volume, and the breakout MUST show surging volume
- Buying during the flag phase impatiently instead of waiting for the breakout
- Not having the conviction to hold through the second advance after the breakout
Advanced Techniques
- Screen for stocks up 100%+ in 8 weeks with tight consolidation using relative strength filters
- Combine with fundamental analysis — the best HTFs have earnings growth of 25%+ quarterly
- Use weekly charts to identify the HTF, then daily charts for precise breakout entry
- Trail with the 10-day EMA for maximum profit capture during the breakout advance
Institutional Perspective
The HTF is a favorite among growth fund managers. The 100% advance signals institutional discovery, and the tight flag proves they are still accumulating. Fund managers view the breakout as a signal to add aggressively, knowing the tight holders won't be selling.
Fun Facts
- William O'Neil found that the High Tight Flag appeared in many of the greatest stock winners before their biggest advances in his study of 100+ years of market data.
- Some of the most famous HTF examples include early moves in Apple, Google, and Monster Beverage.
- The HTF is so rare that entire market years can pass without a textbook example forming.
Frequently Asked Questions
A stock must advance at least 90-100% within approximately 8 weeks (the flagpole), then consolidate with no more than a 10-25% pullback from the high (the flag), before breaking out on heavy volume.
Very rare. In any given year, you might find only a handful of true HTF setups among thousands of stocks. Their rarity is what makes them so powerful.
On average, successful HTF breakouts produce a 30-45% advance, with the best setups doubling again. The measured move target equals the flagpole height projected from the breakout.