Overview
Bullish Harami Cross
Harami Yose Sen (孕み寄せ線)
Also known as: Bullish Inside Doji, Harami Cross Bottom
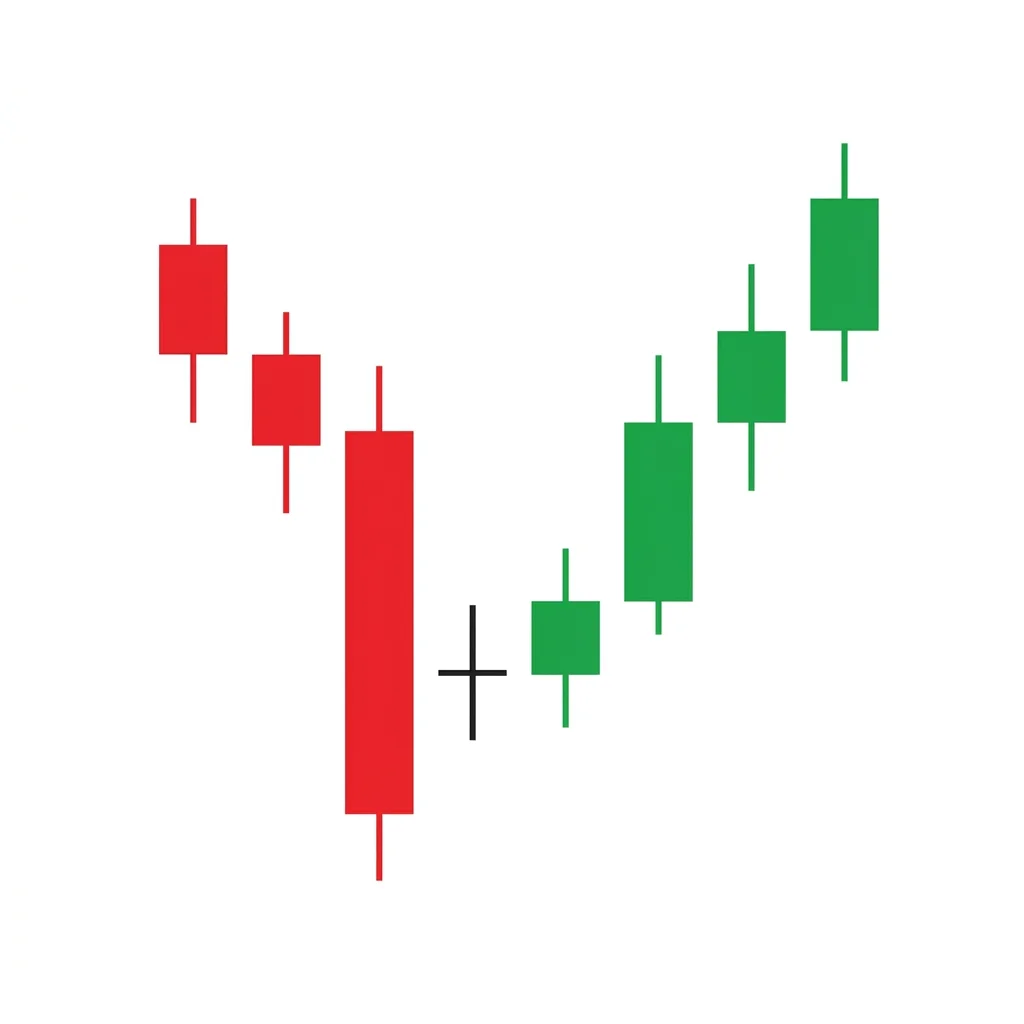
The Bullish Harami Cross is a two-candle reversal pattern where a doji forms within the body of a preceding large bearish candle, indicating strong indecision and a potential bottom.
The Bullish Harami Cross is a stronger variant of the standard Bullish Harami. Instead of a small bullish candle, the second candle is a doji—a candle where the open and close are virtually identical. This doji within the large bearish body represents a complete stalemate between buyers and sellers after bears had been firmly in control. The doji signals that the market has reached equilibrium, and the prior bearish momentum has stalled entirely. This abrupt halt in selling pressure often precedes a reversal, especially when confirmed by subsequent bullish price action.
History & Etymology
Like the standard harami, the Harami Cross has its roots in Japanese rice trading. The cross variant was noted as a particularly significant signal by Munehisa Homma and later formalized in Steve Nison's work on candlestick patterns. The doji component adds the significance of total market indecision to the containment signal.
Harami means 'pregnant' in Japanese. The 'cross' refers to the doji shape of the second candle, which resembles a cross or plus sign. Together, the name describes a cross-shaped candle contained within a larger candle body.
How It Forms
Formation Steps
- 1First candle: large bearish candle with a wide real body
- 2Second candle: a doji whose body is entirely within the first candle's body
Prerequisites
- Established downtrend
- First candle has a large bearish real body
- Second candle is a doji contained within the first candle's body
Confirmation Signals
- Third candle closes above the high of the doji
- Volume increases on the confirmation candle
- RSI shows bullish divergence
Invalidation Signals
- Price breaks below the low of the first candle
- Heavy selling volume continues after the pattern
- Third candle is a strong bearish candle
Candle Breakdown
Mother Candle
A large bearish candle showing strong selling pressure and continuation of the downtrend
Bears are in complete control, pushing prices aggressively lower. Confidence among sellers is high.
Doji Cross
A doji candle where open and close are nearly identical, contained entirely within the first candle's body
Total equilibrium between buyers and sellers. The market has come to a standstill, and bears can no longer push prices lower.
Psychology
The Harami Cross represents a dramatic shift from bearish dominance to complete market indecision. The doji signals that bears have entirely lost momentum, creating a vacuum where buyers can step in.
Buyer Perspective
Buyers see the doji as proof that selling has dried up. The perfect balance of the doji within the large bearish candle suggests a floor has been found.
Seller Perspective
Sellers are alarmed by the sudden loss of momentum. After a strong bearish push, the inability to continue lower triggers profit-taking and short-covering.
Smart Money Action
Smart money uses the doji as a signal to begin accumulating. The low volume on the doji confirms retail selling has dried up, allowing institutions to build positions quietly.
Retail Trader Trap
Retail shorts who piled in on the large bearish candle find themselves trapped when the doji signals the momentum shift. Their stop-loss buying fuels the subsequent reversal.
Emotional Cycle
Trading Strategy
Aggressive Entry
Enter long at the close of the doji candle with a stop below the first candle's low.
Conservative Entry
Wait for a third candle to close above the doji's high before entering.
Previous swing high or 1:1 risk-reward.
2:1 risk-reward or next resistance zone.
Measured move equal to the first candle's body projected upward.
Best Conditions
- Timeframe: daily
- Timeframe: 4h
- Timeframe: weekly
- oversold conditions
- at major support
- after extended selloff
- Asset: stocks
- Asset: forex
- Asset: indices
Avoid When
- Timeframe: 1m
- Timeframe: 5m
- strong trend with no exhaustion signs
- during earnings season
- before major news events
Confluence Factors
- Key support level alignment
- RSI bullish divergence
- 50 or 200-day moving average proximity
- Fibonacci 61.8% retracement level
- Volume climax on preceding selloff
Scale In Strategy
Add to the position on the first successful retest of the breakout level.
Scale Out Strategy
Take one-third at TP1, one-third at TP2, trail the remainder.
Risk Management
Volume Analysis
Volume Confirmation
Volume should decline on the doji and surge on the confirmation candle.
Volume Profile
High volume on the first candle with significantly lower volume on the doji confirms selling exhaustion.
Volume Divergence
Declining volume throughout the downtrend leading to the pattern increases reversal probability.
Technical Confluence
Support Resistance
Strongest when the doji forms precisely at a known support level or demand zone.
Fibonacci Levels
The 50% and 61.8% retracement levels add strong confluence to this pattern.
Moving Averages
Pattern forming at the 50 or 200-day moving average increases win rate significantly.
Rsi Confirmation
RSI below 30 with bullish divergence is the ideal companion signal.
Macd Confirmation
MACD histogram flattening or crossing bullish near the pattern strengthens the signal.
Bollinger Bands
Doji touching or piercing the lower Bollinger Band adds a mean-reversion confluence.
Vwap
Below VWAP with a subsequent reclaim on the confirmation candle validates the reversal.
Ichimoku Cloud
Pattern below the cloud with a bullish TK cross signals a potential trend change.
Elliott Wave
Often marks the end of Wave 5 down or the termination of Wave C in a correction.
Wyckoff Phase
Appears during the spring or test after spring in Wyckoff accumulation.
Market Profile
Strongest at the Value Area Low or naked Point of Control.
Order Flow
Look for absorption of sell orders on the doji and emerging buy-side aggression.
Open Interest
Declining open interest on the doji confirms short-covering rather than new selling.
Multi-Timeframe Analysis
Higher Timeframe Alignment
A weekly uptrend or weekly support level greatly increases the daily harami cross reliability.
Lower Timeframe Entry
After a daily harami cross, drop to the 1H chart to find a micro double bottom or trendline break for precision entry.
Timeframe Confluence
The pattern on multiple timeframes simultaneously is rare but extremely powerful.
Top-Down Approach
Identify weekly support zones, look for daily harami cross formation, and use 4H for entry timing.
Statistics
Historical Examples
Microsoft Reversal at 200-DMA
successMSFT formed a bullish harami cross right at its 200-day moving average around $200. The doji signaled exhaustion, and the stock rallied 12% over the next three weeks.
Lesson: Harami cross patterns at major moving averages offer high-probability reversal trades.
Bitcoin Indecision at Support
successBitcoin formed a harami cross near $29,000 support. The doji marked the bottom, and BTC rallied to $42,000 within a month.
Lesson: Crypto markets respect candlestick patterns, especially at strong psychological levels.
Variations
Long-Legged Harami Cross
A harami cross where the doji has exceptionally long upper and lower shadows.
Gravestone Harami Cross
The doji within the harami is a gravestone doji with a long upper shadow.
Confusion Matrix
Patterns commonly confused with Bullish Harami Cross and how to distinguish them.
Bullish Harami
9000% similarCheck if the second candle's open and close are virtually equal. If yes, it's a Harami Cross.
Key Differences
- Standard harami has a small bullish body; harami cross has a doji
- Harami cross signals stronger indecision
Bullish Doji Star
7000% similarA Doji Star gaps away from the first candle. A Harami Cross is contained within the first candle's body.
Key Differences
- Doji Star typically gaps down from the first candle
- Harami Cross has the doji contained within the body without requiring a gap
The bearish harami cross is a two-candle reversal pattern where a large bullish candle is followed by a doji contained within the first candle's body. The doji represents complete indecision, making this a slightly stronger reversal signal than the standard harami.
The Bullish Doji Star is a two-candle pattern where a doji gaps below a bearish candle, signaling that selling momentum has stalled and a potential reversal is forming.
The Dragonfly Doji is a powerful single-candle reversal signal where sellers push price significantly lower during the session, but buyers fight back to close at the opening level, creating a T-shaped candle that signals complete rejection of lower prices.
The Bullish Engulfing is one of the most popular and reliable two-candle reversal patterns. A large bullish candle completely engulfs the prior bearish candle body, signaling a decisive shift from selling to buying control.
The Bullish Harami is a two-candle reversal pattern where a small bullish candle is entirely contained within the body of the preceding large bearish candle, signaling a potential end to a downtrend.
The Confirmed Shooting Star adds a bearish confirmation candle to the classic shooting star, eliminating the ambiguity of the standalone pattern and creating a higher-probability reversal signal at the top of uptrends.
Pro Tips & Common Mistakes
Pro Tips
- The harami cross is more reliable than the standard harami because the doji represents complete indecision
- Pay close attention to the shadows of the doji — long shadows indicate wider price exploration and stronger reversal potential
- The pattern is most powerful after a sharp, fast decline rather than a slow, grinding downtrend
- Use volume analysis as a filter — the doji should have noticeably lower volume than the first candle
- Consider the pattern as part of the larger Three Inside Up formation for higher probability setups
Common Mistakes
- Not waiting for the confirmation candle and entering on the doji alone
- Failing to verify that the doji is truly contained within the first candle's body
- Placing stops too tight, below the doji instead of below the first candle
- Ignoring the trend context — the pattern requires a prior downtrend to be valid
- Over-optimizing the doji definition — small bodies are acceptable for the cross variant
Advanced Techniques
- Combine with delta divergence on the doji to confirm buy-side absorption
- Use the doji's midpoint as a key level — price should not return below it after confirmation
- Apply mean-reversion strategies when the pattern forms below the lower Bollinger Band
- Use options strangles on the doji, then convert to directional once confirmation appears
Institutional Perspective
Institutions treat the harami cross as a high-confidence exhaustion signal. The doji within the large body indicates that the selling vacuum has been filled, and they begin to initiate positions or add to existing longs at this equilibrium point.
Fun Facts
- In traditional Japanese analysis, the harami cross was considered one of the most important two-candle reversal patterns.
- The doji cross shape within the large candle was likened to a spiritual crossroads — a decision point for the market's direction.
- Some studies show the harami cross performs best on Wednesdays, possibly due to mid-week repositioning by institutional traders.
Frequently Asked Questions
The Harami Cross uses a doji as the second candle instead of a small bullish body. The doji represents complete indecision between buyers and sellers, making it a slightly stronger reversal signal.
Yes, the Harami Cross is generally considered 5-10% more reliable because the doji signals a complete halt in selling momentum, whereas a small bullish body in the standard harami still shows some directional bias.