Overview
Bullish Gap and Go
Also known as: Gap Up and Go, Opening Gap Momentum, Gap Continuation
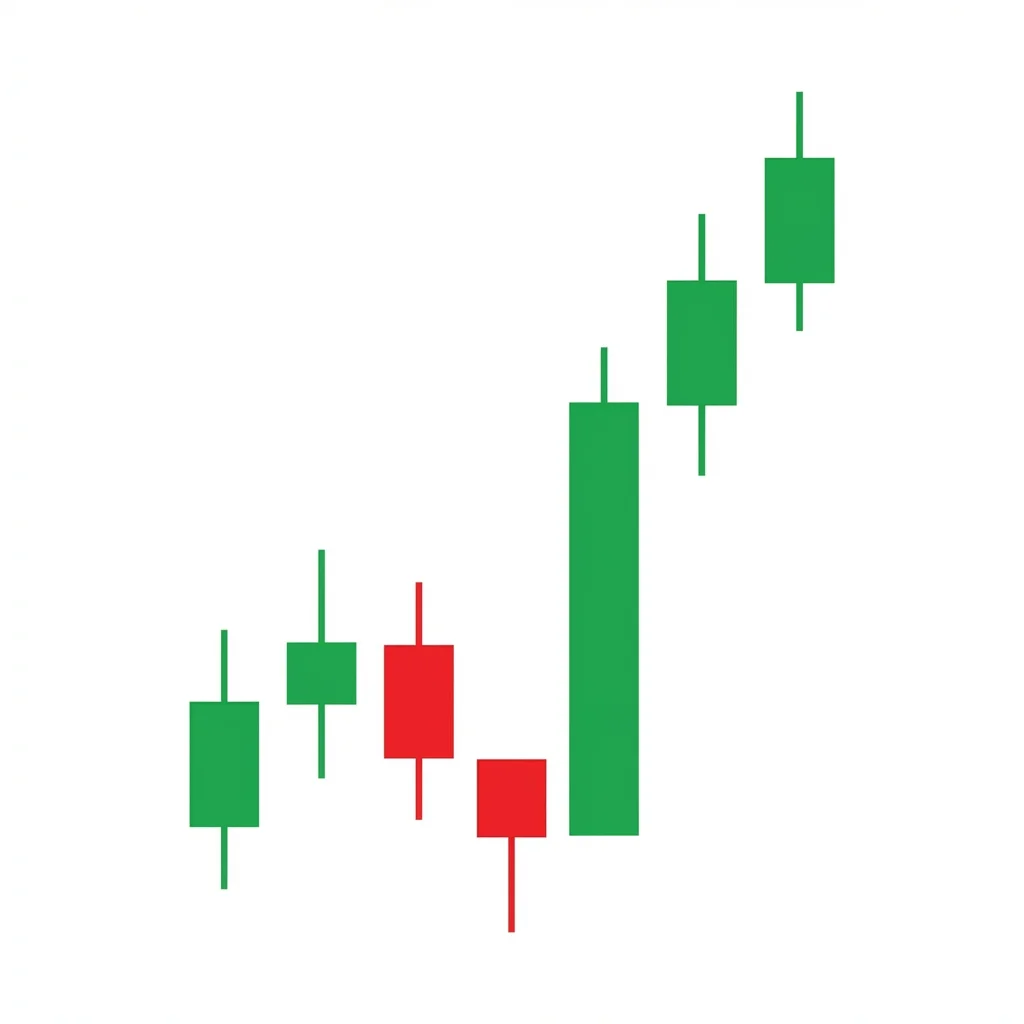
The Gap and Go occurs when price gaps up on a catalyst, and instead of filling the gap, continues higher as momentum buying drives the stock to new levels throughout the session.
The Gap and Go is a momentum-driven pattern popular among day traders and swing traders. It occurs when a stock gaps up significantly at the open, often driven by a catalyst such as earnings, news, or an analyst upgrade. The key characteristic is that the gap does not fill. Instead, buyers continue to push prices higher after the open, creating a trend day. This pattern works because the gap represents a genuine repricing of the asset, and the continued buying after the open confirms that the new valuation is accepted and even deemed insufficient by the market. The gap acts as a launchpad rather than a peak.
History & Etymology
The Gap and Go strategy was popularized by day trading educators in the 2010s, though the concept of trading with momentum after gap openings has existed since the early days of stock markets. The pattern gained particular popularity with the rise of pre-market trading and real-time data access.
Gap refers to the opening gap, and Go refers to the continuation momentum. The name is a direct description: the stock gaps up and then goes (continues moving higher).
How It Forms
Formation Steps
- 1Price gaps up significantly above the prior close (typically 2%+ for stocks)
- 2After the gap, price does not fill the gap but continues higher
- 3The gap remains open as buyers maintain control
Prerequisites
- A catalyst (earnings, news, upgrade) causing the gap
- Pre-market volume should be significantly above average
- The gap should be substantial (not just a minor open above the close)
Confirmation Signals
- Price holds above the prior close level after the gap
- Volume remains elevated throughout the first session
- Price makes new highs during the first session after the gap
- No significant selling into the gap zone
Invalidation Signals
- Price fills the gap (returns to the prior close)
- Volume diminishes rapidly after the open
- Selling pressure drives price below the pre-market low
Candle Breakdown
Gap Opening
Price opens significantly above the prior close, creating a visible gap.
The gap shocks the market into repricing the asset. Those who were short or flat overnight are immediately at a disadvantage.
Continuation
Price continues higher after the gap, not filling it, with sustained volume.
The market confirms the gap was not an overreaction. FOMO buying, short covering, and institutional allocation all drive continued momentum.
Psychology
Gap and Go patterns reflect genuine shifts in perception. The gap is the market suddenly repricing an asset, and the continued move is the market accepting and building on that new price level.
Buyer Perspective
Buyers see the gap as confirmation of their thesis (earnings beat, positive news). They buy aggressively, knowing the catalyst justifies higher prices.
Seller Perspective
Shorts caught by the gap face immediate losses. Some cover immediately (adding buying pressure), while others hope for a pullback that never comes.
Smart Money Action
Institutional buyers who receive new information overnight (earnings, upgrades) execute large orders at the open, creating the gap. Their continued buying throughout the session creates the Go.
Retail Trader Trap
Retail traders who short the gap expecting it to fill are squeezed as the stock continues higher. Others sell too early in the move.
Emotional Cycle
Trading Strategy
Aggressive Entry
Buy at the open or within the first 5 minutes if the stock holds above the pre-market high.
Conservative Entry
Wait for a pullback to the opening range (VWAP or opening price) and enter on the first higher low.
Pre-market high if entered at the open.
A measured move based on the gap size projected from the opening range.
At the next major resistance level.
Best Conditions
- Timeframe: 1m
- Timeframe: 5m
- Timeframe: 15m
- Timeframe: daily
- After earnings beats
- After positive news events
- In bull markets where gaps are followed through
- During high-liquidity sessions
- Asset: stocks
- Asset: futures
- Asset: crypto
Avoid When
- Timeframe: weekly
- In bear markets where gaps are sold
- Low-volume environments
- When the gap is based on rumors not facts
Confluence Factors
- Strong catalyst (earnings beat, upgrade)
- Pre-market volume 3x+ normal
- Gap above key resistance
- Sector showing similar gap behavior
- Strong pre-market price action
Scale In Strategy
Enter 50% at the open, add 50% on the first higher low above VWAP.
Scale Out Strategy
Take 33% at the pre-market high, 33% at the measured move, trail the rest.
Risk Management
Volume Analysis
Volume Confirmation
Pre-market volume should be 2-5x normal. The first 30 minutes should maintain above-average volume.
Volume Profile
Sustained high volume throughout the session confirms genuine institutional interest.
Volume Divergence
Declining volume after the open suggests the gap may fill. Exit or reduce size.
Technical Confluence
Support Resistance
The gap zone (between prior close and today's open) becomes a key support level. If the gap holds, it confirms the new price level.
Fibonacci Levels
Less relevant for intraday gap trades, but the gap can represent a breakout above a Fibonacci level.
Moving Averages
Gapping above the 50 or 200 SMA and holding is particularly bullish.
Rsi Confirmation
RSI will be high on the gap, which is expected. Look for RSI holding above 60 throughout the day.
Macd Confirmation
MACD will turn bullish on the gap. Positive histogram expansion confirms the momentum.
Bollinger Bands
The gap will push price above the upper band. Staying above the band confirms the trend day.
Vwap
VWAP from the open is the key reference. Price holding above VWAP all day is the hallmark of a successful gap and go.
Ichimoku Cloud
Gapping above the cloud confirms a bullish trend change.
Elliott Wave
Gaps often initiate Wave 3 moves in Elliott Wave counting.
Wyckoff Phase
A gap can serve as the Jump Across the Creek (JAC) event marking the start of markup.
Market Profile
The gap creates a range extension. Single prints above the prior day range confirm the trend day.
Order Flow
Persistent positive delta throughout the session confirms sustained buying.
Open Interest
In options, surging call volume and open interest on the gap day confirms bullish positioning.
Multi-Timeframe Analysis
Higher Timeframe Alignment
A daily gap above weekly resistance is the strongest setup.
Lower Timeframe Entry
Use the 5-minute chart to time entries during the first hour of the gap session.
Timeframe Confluence
A 5-minute entry in a daily gap that breaks a weekly resistance level is triple-confirmed.
Top-Down Approach
Weekly resistance identified, daily gap above it, 5-minute opening range breakout for entry.
Statistics
Historical Examples
Meta Gap and Go Post-Earnings
successMeta gapped up 20% after reporting better-than-expected earnings and announcing a buyback. The gap never filled, and the stock continued rallying for weeks, gaining another 30% above the gap level.
Lesson: Gap and Go patterns driven by genuine fundamental catalysts (earnings beats + buybacks) can produce moves that extend far beyond the initial gap.
Variations
Gap and Crap
A failed gap and go where the gap fills and price returns to the prior close.
Gap and Go Extended
The momentum continues for 2-3 days beyond the gap day.
Confusion Matrix
Patterns commonly confused with Bullish Gap and Go and how to distinguish them.
Bullish Gap Momentum
8500% similarGap and Go is a specific intraday strategy. Gap Momentum is a broader pattern concept that can be applied to any timeframe.
Key Differences
- Gap and Go specifically refers to the day-trade strategy of trading the gap continuation
- Gap Momentum is a broader concept about sustained momentum after a gap
The Bullish Breakaway is a five-candle reversal pattern where a gap-down continuation is followed by progressively smaller candles and a strong bullish candle that reclaims the gap, signaling exhaustion of selling pressure.
The Bullish Rising Window is a gap-up pattern where the second candle's low is entirely above the first candle's high, creating a visible window (gap) that acts as future support and signals trend continuation.
The Bullish Runaway Gap (Measuring Gap) occurs in the middle of a strong uptrend, signaling that the trend has strong momentum and is likely to continue. It can also be used to project the trend's target — the distance from the trend start to the gap is projected above the gap.
A falling window is a Japanese candlestick term for a gap down in price where the high of the current candle is below the low of the previous candle, signaling strong bearish continuation momentum.
The bearish gap fill rejection occurs when price rallies to fill a prior gap down but is rejected at or within the gap zone, confirming the gap as resistance and signaling continuation of the downtrend.
The bearish gap momentum pattern occurs when price gaps down on high volume and continues selling throughout the session without filling the gap, indicating powerful one-directional selling pressure.
Pro Tips & Common Mistakes
Pro Tips
- Pre-market volume is the best predictor of gap and go success, look for at least 3x normal pre-market volume
- The first 5-minute candle sets the tone. If it holds above the prior day high, the gap is likely to hold
- VWAP is your best friend for gap trades. Price above VWAP = gap holding. Price below VWAP = gap failing
- The strongest gap and go setups gap above a key resistance level, turning resistance into support
- Not all gaps are created equal. Catalyst-driven gaps (earnings, news) are far more reliable than random gaps
Common Mistakes
- Chasing the gap at the open without waiting for the first pullback
- Averaging down into a failing gap (the gap should hold from the start)
- Trading every gap without checking the catalyst quality
- Not having a clear stop level before entering
- Holding gap trades overnight when they were intended as day trades
Advanced Techniques
- Use the opening range breakout (ORB) strategy on gap days, buying above the first 5/15/30-minute range
- Monitor Level 2 and time & sales for institutional order flow at the open
- Use pre-market VWAP as an initial reference before the regular session VWAP takes over
Institutional Perspective
Institutional traders often cause gap and go patterns by executing large orders at the open after receiving new information. Their algorithms are designed to buy aggressively at the open and throughout the day when a catalyst justifies a repricing.
Fun Facts
- Studies show that stocks gapping up on earnings that hold their gap by the end of the first hour go on to outperform the market over the next quarter.
- The term Gap and Crap (the failure mode) has become so well-known that some traders exclusively trade the reversal of failed gaps.
Frequently Asked Questions
Pre-market volume is the best predictor. Gaps with 3x+ normal pre-market volume hold more often. Also check: is there a genuine catalyst? Is the stock gapping above key resistance? Does VWAP support the gap? If yes to all three, the gap is likely to hold.