Overview
Bullish Hikkake
Also known as: Inside Bar False Breakout, Bullish Hikkake Trap
The Bullish Hikkake is a deceptive pattern that traps sellers with a false downside breakout of an inside bar, then reverses sharply higher as trapped shorts are forced to cover.
The Hikkake pattern, introduced by Daniel Chesler in 2004, exploits the common inside bar breakout strategy. An inside bar forms, and traders expect a breakout in the direction of the break. When price breaks below the inside bar's low, shorts enter. But the move fails quickly, and price reverses above the inside bar's high. The trapped shorts are forced to cover, and their buying fuels the upside move. The name 'hikkake' comes from the Japanese word meaning 'to trick or deceive,' perfectly describing the pattern's trap mechanism.
History & Etymology
Daniel Chesler first described the Hikkake pattern in a 2004 article for Technical Analysis of Stocks & Commodities magazine. He identified it as a systematic way to trade failed inside bar breakouts, a phenomenon that traders had observed informally for years.
Hikkake (引っ掛け) is Japanese for 'trick,' 'trap,' or 'ensnare.' The name reflects the pattern's core mechanism: tricking traders who follow the initial breakout direction, then trapping them as price reverses.
How It Forms
Formation Steps
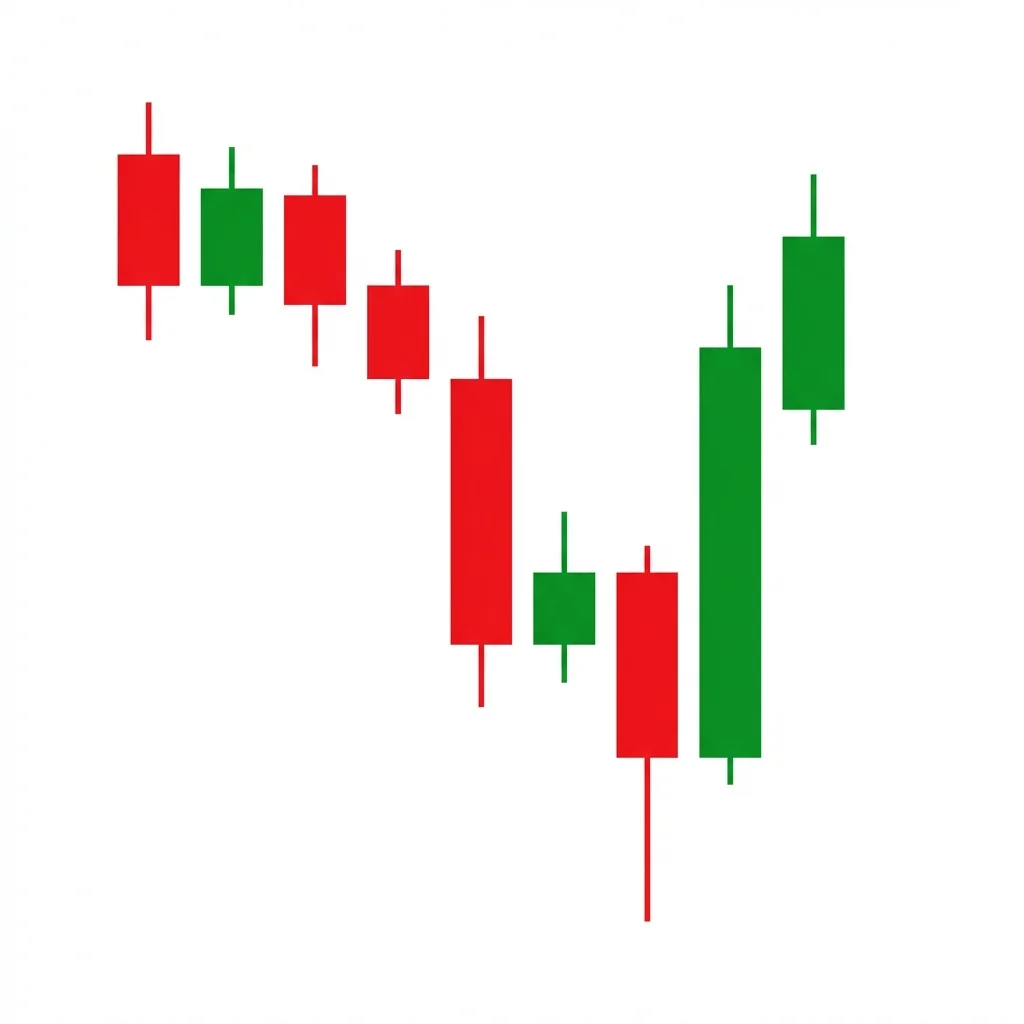
- 1Candle 1: mother bar (any color) that establishes the range
- 2Candle 2: inside bar — its high and low are within candle 1's range
- 3Candle 3: breaks below the inside bar's low (false breakdown)
- 4Candle 4+: reverses and closes above the inside bar's high, confirming the trap
Prerequisites
- A clear inside bar must form (high lower than prior high, low higher than prior low)
- A false breakout below the inside bar low must occur
- The false breakout must reverse within 3 bars
Confirmation Signals
- Price closes above the high of the inside bar (candle 2)
- Volume increases on the reversal candle
- Shorts get trapped on the false breakdown
Invalidation Signals
- Price continues lower after the breakdown without reversing within 3 bars
- Price closes below the mother bar's low
- No upside follow-through within the confirmation window
Candle Breakdown
Mother Bar
The reference bar that establishes the range for the inside bar
Sets the stage by establishing a range that the market will test and trap around.
Inside Bar
A bar whose entire range (high to low) is within the mother bar's range, showing contraction
Volatility contracts and traders prepare for a breakout. Both sides are poised to act.
False Breakdown
Price breaks below the inside bar's low, luring in short sellers
Shorts jump in on the breakdown. But the move lacks follow-through — the trap is being set.
Reversal / Confirmation
Price reverses and closes above the inside bar's high, confirming the trap
Trapped shorts panic-cover, and buyers pile in. The combined buying pressure drives an explosive move.
Psychology
The Hikkake exploits the crowd's tendency to trade inside bar breakouts mechanically. By trapping those who followed the false breakdown, it converts their losing positions into fuel for the reversal.
Buyer Perspective
Smart buyers recognize the false breakdown and use it as a high-conviction entry. They know the trapped shorts will provide buying pressure through stop-loss covering.
Seller Perspective
Sellers who shorted the breakdown are caught offside. As price reverses above the inside bar, their stops are triggered, accelerating the upside move.
Smart Money Action
Institutions often engineer the false breakdown to accumulate at lower prices. They buy the false move, knowing that retail stops below the inside bar provide liquidity for their orders.
Retail Trader Trap
Retail traders who mechanically short inside bar breakdowns are the primary victims. Their predictable behavior is exploited by the pattern.
Emotional Cycle
Trading Strategy
Aggressive Entry
Enter long when price closes back above the inside bar's low (showing the breakdown has failed).
Conservative Entry
Enter when price closes above the inside bar's high, fully confirming the hikkake.
1:1 risk-reward based on stop distance.
2:1 risk-reward or next resistance level.
Measured move equal to the mother bar's range projected upward from the breakout.
Best Conditions
- Timeframe: daily
- Timeframe: 4h
- Timeframe: 1h
- ranging markets
- at support levels
- after extended downtrends
- Asset: stocks
- Asset: forex
- Asset: futures
- Asset: crypto
Avoid When
- Timeframe: 1m
- Timeframe: 5m
- strong trends
- panic selling
- illiquid markets
Confluence Factors
- Pattern forms at a key support level
- RSI shows bullish divergence
- False breakdown sweeps a well-known stop zone
- Smart money concepts: liquidity grab below inside bar
- Volume confirms the trap (low on breakdown, high on reversal)
Scale In Strategy
Enter 50% on the initial reversal signal, add 50% when price closes above the inside bar's high.
Scale Out Strategy
Take one-third at 1:1 R:R, one-third at 2:1 R:R, trail the remainder.
Risk Management
Volume Analysis
Volume Confirmation
Low volume on the false breakdown and high volume on the reversal confirms the trap.
Volume Profile
Volume spike on the reversal candle is the key confirmation signal.
Volume Divergence
If volume is high on the breakdown, the move may be genuine rather than a trap — use caution.
Technical Confluence
Support Resistance
Most effective when the false breakdown occurs at or just below a key support level.
Fibonacci Levels
False breakdowns below the 50% or 61.8% retracement level followed by reversal are powerful setups.
Moving Averages
Hikkake patterns near the 50 or 200-day moving average add significant confluence.
Rsi Confirmation
RSI bullish divergence during the false breakdown dramatically increases win rate.
Macd Confirmation
MACD histogram turning positive on the reversal candle confirms momentum shift.
Bollinger Bands
False breakdown below the lower Bollinger Band followed by a close back inside is a classic hikkake setup.
Vwap
False breakdown below VWAP with a quick reclaim is an intraday hikkake variant.
Ichimoku Cloud
The false breakdown below a cloud support level that reverses back above adds confluence.
Elliott Wave
Hikkake patterns often form at the end of Wave 2 or Wave B corrections.
Wyckoff Phase
The pattern is structurally similar to a Wyckoff spring — a false breakdown that tests supply.
Market Profile
False breakdown below the Value Area Low followed by re-entry into the value area confirms the trap.
Order Flow
Aggressive sell orders on the breakdown are absorbed by passive buyers — visible as buy absorption.
Open Interest
Rising open interest on the breakdown followed by declining OI on the reversal confirms short trapping.
Multi-Timeframe Analysis
Higher Timeframe Alignment
A daily hikkake at a level that is support on the weekly chart is a high-probability trade.
Lower Timeframe Entry
After confirming the hikkake on the daily chart, use the 1H to find the exact reversal candle for a tighter entry.
Timeframe Confluence
The false breakdown visible on a lower timeframe within a higher-timeframe support zone is the ideal setup.
Top-Down Approach
Identify support on the weekly, look for inside bars on the daily, and trade the hikkake on the 4H for precision.
Statistics
Historical Examples
EUR/USD False Breakdown Trap
successEUR/USD formed an inside bar at 1.0000 parity support. Price broke below briefly to 0.9952, trapping shorts, then reversed sharply above 1.0050 within 3 candles.
Lesson: Hikkake patterns at major psychological levels (like parity) are especially powerful due to the concentration of stops.
Amazon Support Hikkake
successAmazon formed an inside bar at the $90 support level. A brief breakdown to $87 trapped sellers before a powerful reversal to $100+ over the following weeks.
Lesson: The hikkake works exceptionally well at well-established support levels where many stops cluster.
Variations
Modified Hikkake
The inside bar is followed by a false breakdown and a gap-up reversal.
Hikkake at Support
The hikkake forms precisely at a known support level, combining the inside bar trap with level-based trading.
Confusion Matrix
Patterns commonly confused with Bullish Hikkake and how to distinguish them.
Bullish Spring
8000% similarIf there's a clear inside bar preceding the false breakdown, it's a hikkake. If it's at the bottom of a broader range, it's more likely a spring.
Key Differences
- Spring is a Wyckoff concept at the bottom of a trading range
- Hikkake specifically requires an inside bar before the false breakdown
Bullish Bear Trap
7500% similarThe hikkake is a specific type of bear trap that uses the inside bar framework.
Key Differences
- Bear trap is a broader concept — any false bearish signal
- Hikkake specifically requires the inside bar setup
The bearish hikkake is a trap pattern where an inside bar is followed by a false upside breakout that quickly reverses, trapping buyers and triggering a selloff below the inside bar's low.
A Bear Trap occurs when price breaks below a key support level, luring bears into short positions, only to reverse sharply higher. The trapped shorts are forced to cover, adding fuel to the bullish reversal.
The Bullish Engulfing is one of the most popular and reliable two-candle reversal patterns. A large bullish candle completely engulfs the prior bearish candle body, signaling a decisive shift from selling to buying control.
The Bullish Harami is a two-candle reversal pattern where a small bullish candle is entirely contained within the body of the preceding large bearish candle, signaling a potential end to a downtrend.
The Bullish Outside Reversal is a two-bar pattern where the second bar has a wider range than the first, trading both below its low and above its high before closing bullish. This dramatic range expansion signals a powerful shift from bearish to bullish control.
The Bullish Spring is a Wyckoff pattern where price briefly breaks below trading range support to trigger stop losses, then immediately reverses back above support, trapping shorts and initiating a markup phase.
Pro Tips & Common Mistakes
Pro Tips
- The false breakdown should be relatively brief (1-3 bars) — extended breakdowns are more likely genuine
- Look for the false breakdown to sweep obvious stop-loss clusters below the inside bar
- Volume should be lower on the breakdown than on the reversal — this confirms the trap
- The pattern is structurally similar to a Wyckoff spring, making it useful in range-trading contexts
- Combine with order flow data to see the short-trapping in real time
Common Mistakes
- Not verifying that the inside bar is genuine (both high and low must be within the prior bar's range)
- Entering too early before the confirmation candle closes above the inside bar's high
- Confusing a genuine breakdown with a hikkake — check volume and momentum for clues
- Using stops that are too tight and getting shaken out during the reversal process
- Not respecting the 3-bar confirmation window — if price doesn't reverse within 3 bars, the pattern fails
Advanced Techniques
- Use the order flow footprint to see trapped sellers in real time during the false breakdown
- Combine with delta analysis — positive delta divergence during the breakdown confirms absorption
- Automate the pattern detection: inside bar → false breakdown → reversal within 3 bars
- Use the hikkake as a filter for other reversal patterns at support levels
Institutional Perspective
Institutional traders are often the ones engineering the false breakdown. They use the liquidity from retail stop-losses below the inside bar to fill their buy orders. Understanding this dynamic is key to trading the hikkake successfully.
Fun Facts
- The Hikkake was first published by Daniel Chesler in 2004, making it one of the newer named patterns in technical analysis.
- In Japanese, hikkake literally means to 'trick' or 'ensnare' — the market is literally trapping traders.
- Studies show that inside bar breakdowns fail approximately 50% of the time, which is exactly what the hikkake pattern exploits.
Frequently Asked Questions
A Hikkake is a pattern where an inside bar forms, price breaks out in one direction (a false breakout), then reverses and closes beyond the opposite side of the inside bar. The bullish version features a false downside breakout followed by an upside reversal.
The reversal should occur within 3 bars of the false breakdown. If price hasn't closed above the inside bar's high within 3 bars, the pattern is considered invalid.
Yes, the mechanics are very similar. Both involve a false breakdown that sweeps stops before reversing. The hikkake specifically requires the inside bar framework, while the spring operates within a broader trading range context.