Overview
Bullish Inverse Head and Shoulders
Also known as: Inverse H&S, Head and Shoulders Bottom, Reverse Head and Shoulders
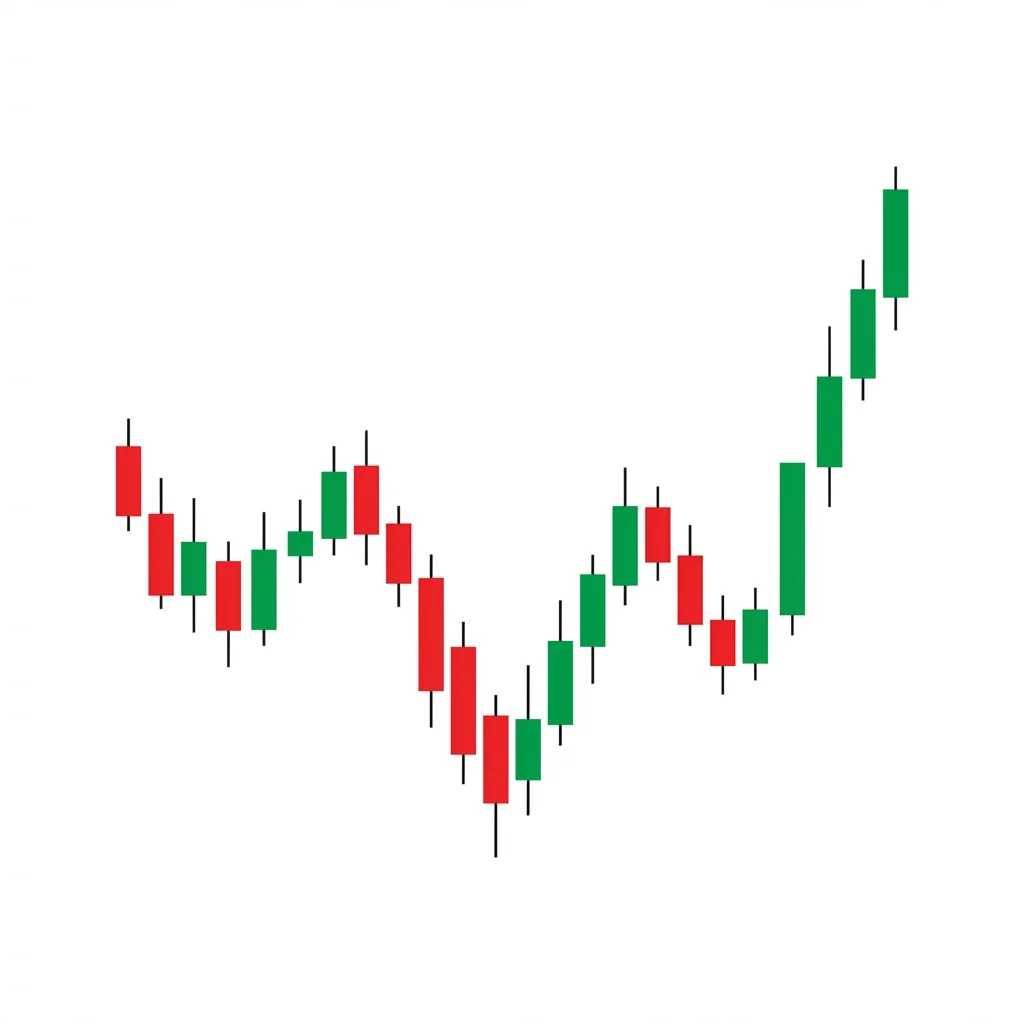
The Inverse Head and Shoulders is one of the most reliable bullish reversal patterns, featuring three troughs with the middle one (head) being the deepest, signaling a major transition from a downtrend to an uptrend.
The Inverse Head and Shoulders (IHS) is the mirror image of the classic head and shoulders top and is one of the most studied and reliable chart patterns in technical analysis. It forms at the bottom of downtrends and signals a major reversal. The left shoulder forms as sellers push price to new lows but fail to sustain them. The head marks the deepest low where selling reaches a climax. The right shoulder, crucially higher than the head, shows that sellers can no longer push price as low, and buyers are gaining control. When price breaks above the neckline, the reversal is confirmed, and the measured move target equals the distance from the head to the neckline projected upward.
History & Etymology
The head and shoulders pattern (and its inverse) was first described by Charles Dow in the early 1900s and later formalized by Richard Schabacker in the 1930s. Edwards and Magee's 1948 'Technical Analysis of Stock Trends' provided the definitive treatment. It is arguably the most well-known chart pattern in all of technical analysis.
The name describes the visual appearance: the pattern looks like an inverted person with the head lower than two shoulders. 'Inverse' differentiates it from the bearish version, which appears right-side up.
How It Forms
Formation Steps
- 1Left shoulder: a trough forming during a downtrend, followed by a rally to the neckline
- 2Head: a deeper trough below the left shoulder, followed by a rally back to the neckline
- 3Right shoulder: a higher trough roughly equal to the left shoulder, followed by a rally
- 4Neckline: the resistance line connecting the highs between the shoulders and head
- 5Breakout: price breaks above the neckline on increased volume
Prerequisites
- Prior downtrend of significant duration
- Three distinct troughs with the middle (head) being the lowest
- Right and left shoulders should be roughly symmetrical in depth
- A neckline can be drawn connecting the rally highs
Confirmation Signals
- Price closes above the neckline on strong volume
- Volume increases on the breakout
- Volume is higher on the right shoulder rally than the left shoulder rally
Invalidation Signals
- Price breaks below the head's low
- Right shoulder drops below the head level
- Multiple failed attempts to break the neckline with declining volume
Candle Breakdown
Left Shoulder Low
Price makes a trough during the downtrend, rallies to form the neckline's left reference point
Bears push price lower in the existing downtrend, but buying emerges to create a bounce.
Head Low
Price drops below the left shoulder to create the deepest trough, then rallies back to the neckline
Selling climax occurs. Maximum fear and capitulation. Smart money begins heavy accumulation.
Right Shoulder Low
Price dips again but fails to reach the head's depth, showing weakening selling pressure
Bears are losing power. The inability to make a new low signals the tide is turning.
Psychology
The IHS traces the psychological journey from bearish dominance through capitulation to bullish reversal. Each successive trough tells a story: the left shoulder shows continuing weakness, the head marks peak pessimism, and the right shoulder proves sellers have exhausted themselves.
Buyer Perspective
Buyers tentatively appear at the left shoulder, accumulate aggressively at the head (climactic selling provides liquidity), and confidently buy the right shoulder dip knowing the pattern is forming.
Seller Perspective
Sellers control the left shoulder decline, throw everything at the head to create new lows, but fail to follow through on the right shoulder. Their inability to make new lows triggers capitulation.
Smart Money Action
Institutions accumulate most aggressively during the head formation when fear is highest and liquidity is abundant. They add to positions on the right shoulder dip and buy the neckline breakout.
Retail Trader Trap
Retail traders who sold the left shoulder and added at the head are trapped when the right shoulder holds higher. Those who finally panic-sell during the head formation sell at the worst possible time.
Emotional Cycle
Trading Strategy
Aggressive Entry
Buy on the right shoulder low with a stop below the head.
Conservative Entry
Buy on the neckline breakout or the neckline retest.
Measured move: distance from head to neckline projected upward from the breakout.
1.5x the measured move.
2x the measured move or major resistance level.
Best Conditions
- Timeframe: daily
- Timeframe: weekly
- Timeframe: 4h
- end of bear market
- bottoming process
- oversold conditions
- Asset: stocks
- Asset: indices
- Asset: crypto
- Asset: forex
- Asset: commodities
Avoid When
- Timeframe: 1m
- Timeframe: 5m
- ongoing crash
- systemic risk event
- liquidity crisis
Confluence Factors
- Volume pattern confirms (decreasing then surging)
- RSI bullish divergence from left shoulder to head to right shoulder
- Head forms at a major support level
- 200-day moving average nearby
- Sector or market turning bullish simultaneously
Scale In Strategy
Enter 33% at the right shoulder, 33% at the neckline breakout, 33% on the neckline retest.
Scale Out Strategy
Take one-third at the measured move, one-third at 1.5x, trail the final third.
Risk Management
Volume Analysis
Volume Confirmation
Volume should decrease from left shoulder to right shoulder, then surge on the neckline breakout.
Volume Profile
Declining volume across the pattern with a volume explosion on breakout is the textbook pattern.
Volume Divergence
Volume higher on the right shoulder than the left is a warning of potential failure.
Technical Confluence
Support Resistance
The head typically forms at a major support level. The neckline becomes the key breakout level and subsequent support.
Fibonacci Levels
The right shoulder often forms at the 38.2% or 50% retracement of the head-to-neckline rally.
Moving Averages
The neckline frequently aligns with the 50 or 200-day moving average, adding major confluence.
Rsi Confirmation
Bullish divergence across the three troughs (RSI makes higher lows while price makes a lower low at the head) is classic confirmation.
Macd Confirmation
MACD histogram making higher lows from left shoulder through head to right shoulder confirms momentum shift.
Bollinger Bands
The head often pierces the lower band while the right shoulder holds within — a sign of decreasing volatility.
Vwap
Multi-day VWAP rising during the right shoulder formation confirms the shift in value.
Ichimoku Cloud
The neckline breakout above the Kumo cloud marks a major trend reversal signal.
Elliott Wave
The IHS often corresponds to the end of a Wave C or Wave 5 decline, marking the start of a new impulse.
Wyckoff Phase
The IHS maps beautifully to the Wyckoff accumulation schematic: left shoulder = preliminary support, head = selling climax/spring, right shoulder = test.
Market Profile
The head forms at the extreme of a developing range, and the neckline breakout initiates a new initiative move.
Order Flow
Massive buy absorption at the head, reduced sell aggression at the right shoulder, and buy-initiated breakout at the neckline.
Open Interest
Rising open interest on the neckline breakout confirms new longs entering — not just short covering.
Multi-Timeframe Analysis
Higher Timeframe Alignment
A monthly or weekly IHS marks major secular trend changes. These are the most powerful signals.
Lower Timeframe Entry
Once the daily IHS is confirmed, use the 4H chart for breakout or retest entries.
Timeframe Confluence
An IHS on the daily within a weekly basing pattern is a high-conviction reversal setup.
Top-Down Approach
Identify the weekly bottoming process, confirm the daily IHS formation, and enter on the 4H breakout.
Statistics
Historical Examples
S&P 500 Great Financial Crisis Bottom
successThe S&P 500 formed a massive inverse head and shoulders from October 2008 to May 2009. The head formed at the March 2009 bottom (~667). The neckline breakout led to a multi-year bull market.
Lesson: The biggest bull markets often begin with large-timeframe IHS patterns. The measured move target was exceeded many times over.
Bitcoin 2019 IHS
successBitcoin formed an IHS from December 2018 to April 2019 with the head at $3,122. The neckline breakout at $4,200 led to a rally above $13,000.
Lesson: Crypto IHS patterns can produce enormous moves. The measured move was $1,100 but the actual move was $9,000+.
EUR/USD Complex IHS
successEUR/USD formed an IHS near parity with the neckline at 1.0090. After breaking out, the pair rallied to 1.0600 over the following weeks.
Lesson: Forex IHS patterns tend to reach their measured move targets accurately.
Variations
Complex Inverse Head and Shoulders
Multiple left and/or right shoulders creating a more complex but equally valid pattern.
Sloping Neckline IHS
The neckline slopes upward or downward rather than being horizontal.
Confusion Matrix
Patterns commonly confused with Bullish Inverse Head and Shoulders and how to distinguish them.
Bullish Double Bottom
6500% similarCount the troughs. Two at the same level = double bottom. Three with the middle lower = IHS.
Key Differences
- Double bottom has two troughs at the same level; IHS has three with the middle deeper
- IHS has the distinct head lower than both shoulders
Bullish Triple Bottom
6000% similarIf the middle trough is clearly deeper than the outer two, it's an IHS. If all three are at the same level, it's a triple bottom.
Key Differences
- Triple bottom has three troughs at roughly the same level
- IHS has the middle trough (head) distinctly lower
The Double Bottom is one of the most recognized reversal patterns, forming a W-shape where price tests a support level twice and bounces, signaling that sellers cannot push through and buyers are gaining control.
The Bullish Engulfing is one of the most popular and reliable two-candle reversal patterns. A large bullish candle completely engulfs the prior bearish candle body, signaling a decisive shift from selling to buying control.
The IHS Neckline Retest is a high-probability continuation entry after an inverse head and shoulders breakout. Price pulls back to test the broken neckline as new support, offering a second chance entry with a tighter stop.
The Morning Star is a three-candle bullish reversal pattern consisting of a large bearish candle, a small star candle showing indecision, and a large bullish candle confirming the reversal. It is one of the most widely recognized and reliable bottom reversal signals.
The Bullish Rounding Bottom (Saucer Bottom) is a long-term reversal pattern that forms a U-shaped curve as selling pressure gradually gives way to buying pressure, signaling a major trend change from bearish to bullish.
The Triple Bottom is a major reversal pattern featuring three distinct lows at approximately the same price level, separated by two intermediate peaks. The breakout above the neckline confirms the reversal and targets a measured move equal to the pattern height.
Pro Tips & Common Mistakes
Pro Tips
- Volume pattern is critical: it should decline from left shoulder through right shoulder and surge on the breakout
- Symmetry between the shoulders (depth and duration) increases reliability
- The neckline doesn't have to be horizontal — sloping necklines are common and valid
- The measured move target (head-to-neckline distance projected upward) is reached about 75% of the time
- Consider the neckline retest as your primary entry — it offers better risk/reward than the breakout entry
Common Mistakes
- Trying to identify the pattern too early — wait for the right shoulder to form and the neckline to be established
- Ignoring volume — an IHS without proper volume characteristics is unreliable
- Setting the stop below the head instead of below the right shoulder (inefficient risk)
- Using the pattern in non-trending contexts where it's just random noise
- Not measuring the target correctly — use the head-to-neckline distance, not the shoulder-to-neckline distance
Advanced Techniques
- Trade the right shoulder formation as a separate setup (buying the dip with a stop below the head)
- Use the neckline retest entry for optimal risk/reward positioning
- Combine with Wyckoff analysis: map the IHS to the accumulation schematic for deeper understanding
- Monitor institutional fund flows during the pattern formation for fundamental confirmation
Institutional Perspective
The inverse head and shoulders is one of the patterns institutional traders respect most. Many fund managers use it as a signal to transition from defensive to aggressive positioning. The volume profile during the pattern reveals institutional accumulation — heavy buying at the head and systematic accumulation through the right shoulder.
Fun Facts
- The head and shoulders pattern was one of the very first chart patterns ever documented, described by Charles Dow over 100 years ago.
- The 2009 stock market bottom formed a textbook inverse head and shoulders on the weekly chart, marking the start of an 11-year bull market.
- Studies by Bulkowski show the IHS has a 74% success rate for reaching its measured move target, making it one of the highest-performing chart patterns.
Frequently Asked Questions
An Inverse Head and Shoulders (IHS) is a bullish reversal chart pattern with three troughs — the middle one (head) deeper than the two outer ones (shoulders). It signals the end of a downtrend when price breaks above the neckline.
Measure the distance from the head (lowest point) to the neckline. Project that same distance upward from the neckline breakout point. This is the measured move target.
It is one of the most reliable reversal patterns with a 70%+ success rate when volume confirms the breakout. The measured move target is reached approximately 75% of the time.