Overview
Bullish Kicker
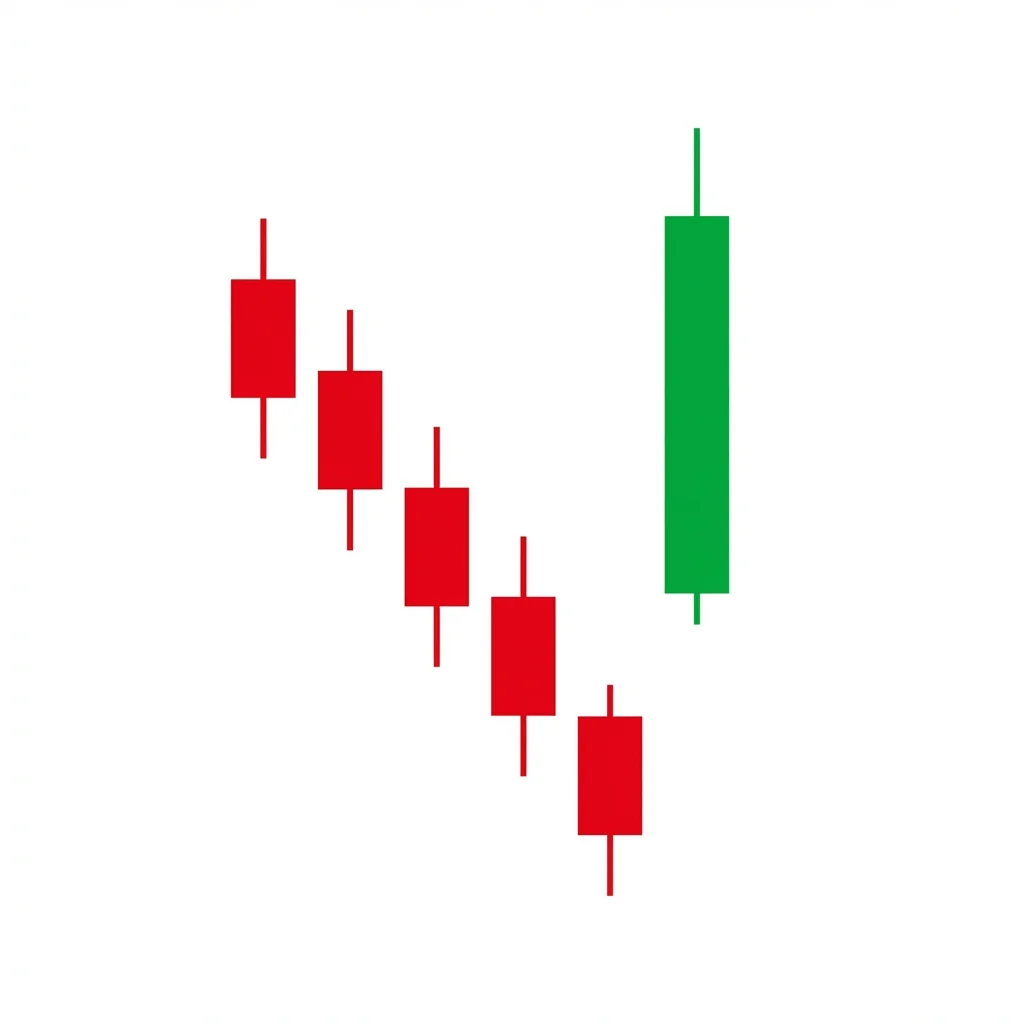
Keri Ashi (蹴り足)
Also known as: Kicking Pattern, Bullish Kick
The Bullish Kicker is one of the strongest two-candle reversal patterns. A bearish candle is followed by a bullish candle that gaps up to open at or above the prior candle's open, signaling an immediate and powerful shift in sentiment.
The Bullish Kicker is considered one of the most powerful candlestick patterns in technical analysis. It occurs when a bearish candle is immediately followed by a bullish candle that gaps up, opening at or above the bearish candle's open price. The gap signifies that overnight or between-session sentiment changed so dramatically that buyers were willing to pay prices at or above where sellers started the prior session. The pattern often occurs after a major fundamental catalyst (earnings surprise, news event) and signals that the prior trend is immediately and decisively over.
History & Etymology
The Kicker pattern is one of the classical Japanese candlestick formations documented by Steve Nison. Its emphasis on the gap between candles reflects the Japanese trading tradition's respect for gaps as significant market events.
The name 'kicker' refers to the sudden, forceful nature of the reversal — like being kicked in a new direction. The Japanese name 'keri ashi' literally means 'kicking leg.'
How It Forms
Formation Steps
- 1First candle: a bearish candle (ideally marubozu) closing near its low
- 2Second candle: a bullish candle that gaps up to open at or above the first candle's open, then closes near its high
Prerequisites
- Prior downtrend or bearish sentiment
- First candle is bearish with a substantial body
- Second candle gaps up above the first candle's open price
Confirmation Signals
- The gap between the two candles remains unfilled
- Volume increases on the second candle
- Price continues higher after the pattern
Invalidation Signals
- The gap is filled (price drops below the second candle's open)
- Volume decreases on the second candle
- Third candle is bearish and closes the gap
Candle Breakdown
Bearish Candle
A strong bearish candle, ideally a marubozu, closing at or near its low
Bears are firmly in control. The market appears decisively bearish.
Bullish Kicker Candle
A strong bullish candle that gaps up to open at or above the first candle's open, closing near its high
A complete, instantaneous reversal in sentiment. Buyers overwhelm with such force that the market gaps above the entire prior session.
Psychology
The Kicker represents the most dramatic possible shift in sentiment. Between sessions, something fundamentally changed — the market went from decisively bearish to decisively bullish with no gradual transition.
Buyer Perspective
Buyers received information that completely changed their outlook. They are willing to pay above the prior session's opening price, indicating extremely strong conviction.
Seller Perspective
Sellers are in complete shock. Their bearish position from the prior session is now deeply underwater, and the gap makes it impossible to exit at reasonable prices.
Smart Money Action
Institutions may have received fundamental information (early earnings data, order flows) that triggered massive overnight repositioning. The kicker reflects their conviction.
Retail Trader Trap
Retail shorts from the first candle face immediate, large losses at the open and are forced to cover, adding buying pressure to the already powerful move.
Emotional Cycle
Trading Strategy
Aggressive Entry
Buy at the open of the second candle if the gap is large and convincing.
Conservative Entry
Wait for the second candle to close near its high, confirming the kicker pattern.
1:1 risk-reward based on the second candle's body size.
2:1 R:R or next major resistance.
Measured move equal to both candles' combined range.
Best Conditions
- Timeframe: daily
- Timeframe: weekly
- after earnings surprise
- after major news catalyst
- sector rotation events
- Asset: stocks
- Asset: indices
- Asset: commodities
Avoid When
- Timeframe: 1m
- Timeframe: 5m
- Timeframe: 15m
- low liquidity
- holiday periods
- no fundamental catalyst
Confluence Factors
- Fundamental catalyst driving the gap
- Heavy volume confirmation
- Pattern at a support level
- Sector-wide bullish shift
- RSI was oversold before the pattern
Scale In Strategy
Enter full position on the kicker — the signal is immediate and decisive.
Scale Out Strategy
Take one-third at 1:1, one-third at 2:1, trail the last third.
Risk Management
Volume Analysis
Volume Confirmation
Volume on the second candle should be at least 50% above the first candle's volume.
Volume Profile
Heavy volume confirms institutional participation in the gap reversal.
Volume Divergence
Low volume on the kicker candle suggests the gap may fill — use caution.
Technical Confluence
Support Resistance
The gap zone becomes strong support that should not be violated.
Fibonacci Levels
The kicker often launches from a Fibonacci support level, adding confluence.
Moving Averages
A kicker that reclaims the 50 or 200-day MA is an extremely bullish signal.
Rsi Confirmation
RSI jumping from oversold to above 50 on the kicker day confirms momentum shift.
Macd Confirmation
MACD bullish crossover on the kicker day is textbook confirmation.
Bollinger Bands
The gap from below the lower band to within the bands shows a powerful mean reversion.
Vwap
Reclaiming multi-day VWAP on the gap up confirms institutional buying.
Ichimoku Cloud
A kicker that gaps above the Kumo cloud is one of the strongest possible buy signals.
Elliott Wave
Kickers often mark the start of Wave 3 — the strongest impulse wave.
Wyckoff Phase
May mark the sign of strength (SOS) in Wyckoff accumulation.
Market Profile
The gap creates a single-print buying tail that acts as permanent support.
Order Flow
Massive initiative buying visible from the open with no sell-side resistance.
Open Interest
Rising open interest on the kicker day confirms new longs entering the market.
Multi-Timeframe Analysis
Higher Timeframe Alignment
A daily kicker within a weekly basing pattern signals the start of a major advance.
Lower Timeframe Entry
Use the 30-minute chart at the open to confirm the gap holds before committing.
Timeframe Confluence
Kickers are primarily a daily phenomenon — they represent overnight sentiment shifts.
Top-Down Approach
Confirm the stock is basing on the weekly chart, then trade the daily kicker at the breakout point.
Statistics
Historical Examples
Meta Platforms Earnings Kicker
successAfter months of bearish action, Meta reported better-than-expected earnings. The stock gapped up 23% in a textbook kicker pattern, launching a multi-month rally.
Lesson: Earnings-driven kickers in oversold stocks can produce some of the most explosive moves in the market.
Netflix Earnings Kicker
successNetflix reported strong subscriber growth after quarters of declines. The kicker gap of 8% launched a sustained rally over the following months.
Lesson: Kicker patterns often mark the exact point where the fundamental story changes.
Variations
Perfect Kicker
Both candles are marubozus with no shadows whatsoever.
Kicker with Continuation Gap
A third candle gaps up from the kicker candle, creating a two-gap sequence.
Confusion Matrix
Patterns commonly confused with Bullish Kicker and how to distinguish them.
Bullish Engulfing
6000% similarIf there's a gap between the candles with the second opening above the first's open, it's a kicker. If bodies overlap, it's an engulfing.
Key Differences
- Kicker requires a gap between candles; engulfing does not
- Kicker's second candle opens above the first candle's open
Bullish Separating Lines
7500% similarIf the second candle opens at the first's open (no gap), it's separating lines. If it gaps above, it's a kicker.
Key Differences
- Separating lines has both candles opening at the same price
- Kicker has a gap between the candles
The bearish kicker is one of the most powerful two-candle reversal patterns. A bullish candle is followed by a bearish candle that gaps down to open at or below the first candle's open, signaling an immediate and complete sentiment reversal.
The Bullish Engulfing is one of the most popular and reliable two-candle reversal patterns. A large bullish candle completely engulfs the prior bearish candle body, signaling a decisive shift from selling to buying control.
The Gap and Go occurs when price gaps up on a catalyst, and instead of filling the gap, continues higher as momentum buying drives the stock to new levels throughout the session.
The Bullish Marubozu is a single candle with no shadows — it opens at the low and closes at the high, representing complete buyer dominance throughout the entire session with no seller resistance.
The Bullish Separating Lines is a two-candle continuation pattern where a bearish pullback candle is followed by a bullish candle opening at the same level, signaling that the uptrend will resume.
The Confirmed Shooting Star adds a bearish confirmation candle to the classic shooting star, eliminating the ambiguity of the standalone pattern and creating a higher-probability reversal signal at the top of uptrends.
Pro Tips & Common Mistakes
Pro Tips
- The gap between the two candles must NOT be filled for the pattern to remain valid
- The strongest kickers have both candles as marubozus (no shadows) — showing total dominance in each session
- Always look for the fundamental catalyst — kickers rarely occur without a reason
- The larger the gap, the more powerful the signal
- Use the gap zone as your stop level — it's the line in the sand for the trade
Common Mistakes
- Trading kicker-like patterns where there is no actual gap between the candles
- Not verifying the gap is above the OPEN of the first candle (not just the close)
- Chasing the move too far above the gap, degrading risk-reward
- Ignoring volume — low-volume kickers can be quickly reversed
- Holding if the gap fills — this immediately invalidates the pattern
Advanced Techniques
- Pre-market analysis: identify potential kickers before the open using pre-market data
- Combine with earnings analysis: kickers after positive earnings surprise in oversold stocks are the highest probability
- Use the first candle's body midpoint as a measured-move projection tool
- Track unfilled kicker gaps as future support levels for pullback entries
Institutional Perspective
The kicker is one of the few patterns that institutional traders consider actionable without additional confirmation. The gap reflects genuine fundamental reassessment, not just technical positioning. Fund managers will often establish new positions or significantly increase existing ones on kicker signals.
Fun Facts
- The Bullish Kicker is statistically one of the top 3 most reliable candlestick patterns ever studied.
- Some of the largest single-day percentage gains in stock market history formed kicker patterns.
- The pattern's Japanese name 'keri ashi' literally means 'kicking leg' — describing the forceful change in direction.
Frequently Asked Questions
The gap between the two candles represents a genuine shift in fundamental assessment — not just technical repositioning. When the market revalues so dramatically that it gaps above the prior candle's open, the signal is extremely strong.
While not technically required, the vast majority of kicker patterns are driven by fundamental catalysts like earnings surprises, product announcements, or major news. Kickers without catalysts are less reliable.