Overview
Bullish Ladder Bottom
Hashigo Gaeshi
Also known as: Ladder Bottom Reversal
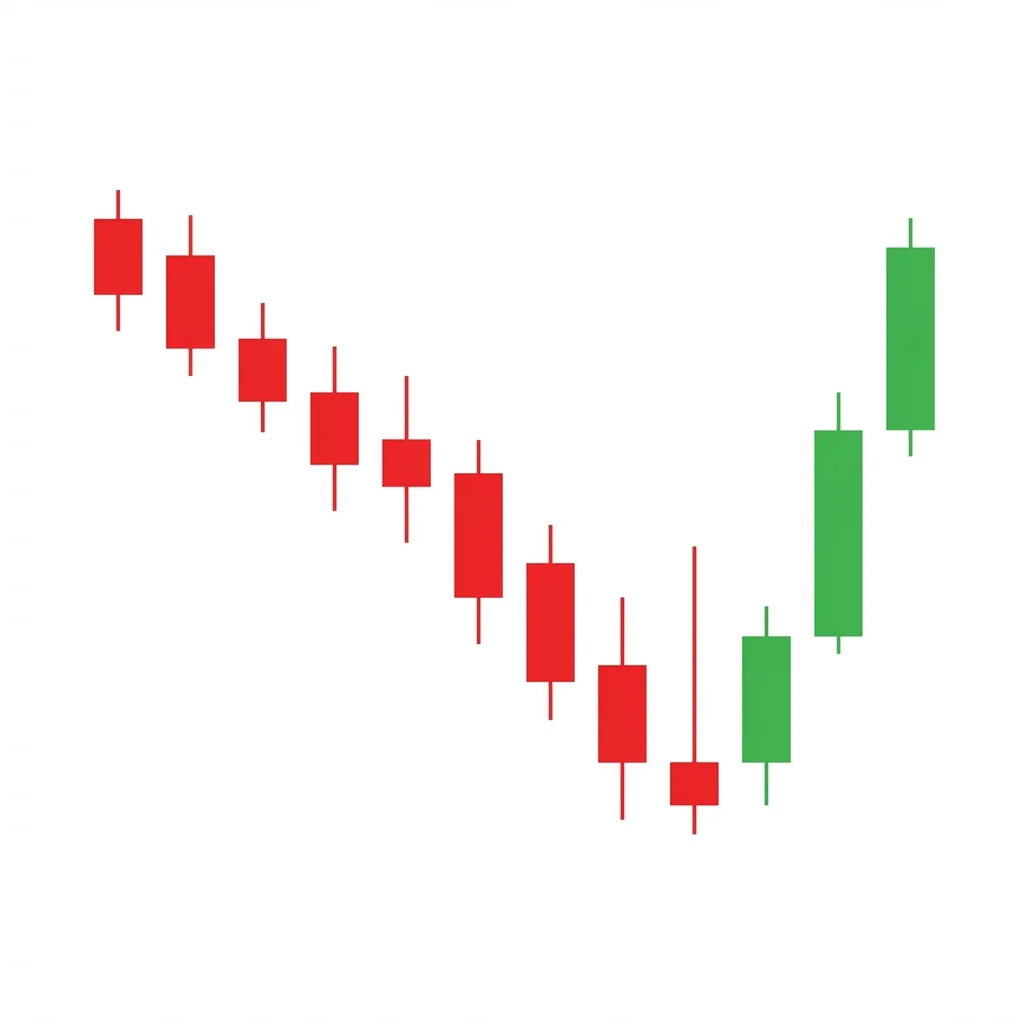
The Ladder Bottom is a five-candle bullish reversal pattern where three descending bearish candles are followed by an exhaustion signal and a confirming bullish candle, resembling climbing down and then back up a ladder.
The Ladder Bottom pattern begins with three consecutive bearish candles making progressively lower closes, resembling the rungs of a descending ladder. The fourth candle shows signs of selling exhaustion — typically through a long upper shadow that indicates buyers are attempting to reverse the trend. The fifth candle confirms the reversal by opening above the fourth candle's body and closing well into the range of the earlier bearish candles. This five-candle structure captures the complete transition from bearish momentum through exhaustion to bullish reversal.
History & Etymology
The Ladder Bottom is a traditional Japanese candlestick pattern described in classical texts on rice trading. It is less commonly traded than simpler patterns but is valued for its clear depiction of the transition from bearish to bullish sentiment over five distinct sessions.
The name refers to the visual of the three descending candles looking like rungs of a ladder going down, followed by the market 'climbing back up the ladder' as the reversal occurs.
How It Forms
Formation Steps
- 1Candles 1-3: three consecutive bearish candles with lower closes, like descending ladder steps
- 2Candle 4: a bearish candle with a long upper shadow or a small body, signaling exhaustion
- 3Candle 5: a bullish candle that opens above the fourth candle's body and closes above the third candle's open
Prerequisites
- Prior downtrend
- Three descending bearish candles
- Fourth candle shows exhaustion
- Fifth candle confirms reversal
Confirmation Signals
- Fifth candle closes above the third candle's open
- Volume increases on the fifth candle
- Sixth candle continues higher
Invalidation Signals
- Price falls below the fourth candle's low
- Fifth candle fails to close above the third candle's open
- Continued bearish action after the pattern
Candle Breakdown
First Rung Down
First bearish candle in the descending sequence
Selling pressure continues the downtrend in a controlled manner.
Second Rung Down
Second bearish candle closing lower than the first
Bears maintain control, stepping the market lower systematically.
Third Rung Down
Third bearish candle, the lowest point of the ladder descent
The final push lower by bears, but momentum may be waning.
Exhaustion Candle
A candle with a long upper shadow showing buyers testing higher prices
Sellers are losing grip. The long upper shadow shows buyers mounting a challenge.
Reversal Candle
A bullish candle that confirms the reversal by closing above the third candle's open
Buyers take control decisively. The ladder is now being climbed upward.
Psychology
The Ladder Bottom tells a five-act story: three sessions of orderly selling, one session of exhaustion where the battle begins, and one session where buyers claim victory.
Buyer Perspective
Buyers see the systematic decline as organized selling that will eventually exhaust. The fourth candle's upper shadow gives them the signal that sellers are tiring.
Seller Perspective
Sellers who controlled the first three candles become alarmed when the fourth candle's upper shadow shows resistance. The fifth candle's strong close forces them to cover.
Smart Money Action
Institutions may be accumulating during the orderly three-candle decline. The exhaustion candle confirms their thesis, and the reversal candle is their trigger to increase positions.
Retail Trader Trap
Retail traders who shorted the orderly decline expecting continuation are trapped by the sudden reversal on the fifth candle.
Emotional Cycle
Trading Strategy
Aggressive Entry
Enter at the close of the fifth candle.
Conservative Entry
Wait for a sixth bullish candle to confirm the reversal.
The open of the first candle (top of the ladder).
2:1 R:R.
Measured move equal to the pattern's total height.
Best Conditions
- Timeframe: daily
- Timeframe: 4h
- oversold conditions
- at support levels
- after steady decline
- Asset: stocks
- Asset: forex
- Asset: indices
Avoid When
- Timeframe: 1m
- Timeframe: 5m
- Timeframe: 15m
- strong downtrend with momentum
- panic selling
- low liquidity
Confluence Factors
- Support level alignment
- RSI bullish divergence
- Moving average proximity
- Volume confirms exhaustion
- Fibonacci support
Scale In Strategy
Enter on candle 5, add on the first higher low after the pattern.
Scale Out Strategy
Take one-third at each profit target.
Risk Management
Volume Analysis
Volume Confirmation
Volume should decrease through candles 1-4 and increase on candle 5.
Volume Profile
Declining volume during the descent with a surge on the reversal is ideal.
Volume Divergence
Increasing volume during the descent suggests stronger selling and lower pattern reliability.
Technical Confluence
Support Resistance
The pattern's low (candle 3-4 area) becomes strong support.
Fibonacci Levels
The descent often ends at a key Fibonacci level (50% or 61.8%).
Moving Averages
The reversal near a major MA adds confluence.
Rsi Confirmation
RSI making higher lows during the descent while price makes lower lows is textbook.
Macd Confirmation
MACD histogram flattening during candles 3-4 and turning positive on candle 5.
Bollinger Bands
The descent approaching the lower band with the reversal back inside is a good signal.
Vwap
Reclaiming VWAP on candle 5 confirms institutional buying.
Ichimoku Cloud
Pattern at or below cloud support with reversal confirmation is valid.
Elliott Wave
The ladder bottom can form at the end of Wave 5 or Wave C.
Wyckoff Phase
The orderly decline and reversal mirror a Wyckoff test phase.
Market Profile
The low candles in a low-volume node suggest price is being rejected from that zone.
Order Flow
Buy absorption visible on candles 4-5 as aggressive sellers find no follow-through.
Open Interest
Declining OI through the descent with rising OI on candle 5 confirms the reversal.
Multi-Timeframe Analysis
Higher Timeframe Alignment
A daily ladder bottom at weekly support increases reliability.
Lower Timeframe Entry
After confirming on the daily, use 4H for precision entry timing.
Timeframe Confluence
The pattern primarily works on daily charts where multi-day selling patterns are clear.
Top-Down Approach
Identify weekly support zones, spot the daily ladder bottom, enter on 4H confirmation.
Statistics
Historical Examples
Procter & Gamble Ladder Bottom
successPG formed a ladder bottom during the COVID selloff with three orderly bearish candles, an exhaustion candle, and a strong reversal. The stock recovered 15% in the following weeks.
Lesson: Defensive stocks often exhibit orderly patterns like the ladder bottom rather than chaotic reversals.
Variations
Extended Ladder Bottom
Four or five bearish candles descend before the exhaustion and reversal candles.
Confusion Matrix
Patterns commonly confused with Bullish Ladder Bottom and how to distinguish them.
Bullish Three Stars South
6500% similarCount the candles and check for the exhaustion (4th) and reversal (5th) candles. Ladder Bottom is five candles.
Key Differences
- Three Stars South has three candles with decreasing ranges; Ladder Bottom has five candles
- Ladder Bottom includes an explicit exhaustion and reversal candle
The ladder top is a five-candle bearish reversal pattern where three bullish candles climb like a ladder, a fourth candle shows hesitation, and a fifth bearish candle confirms the reversal by closing below the third candle's close.
The Bullish Engulfing is one of the most popular and reliable two-candle reversal patterns. A large bullish candle completely engulfs the prior bearish candle body, signaling a decisive shift from selling to buying control.
The Morning Star is a three-candle bullish reversal pattern consisting of a large bearish candle, a small star candle showing indecision, and a large bullish candle confirming the reversal. It is one of the most widely recognized and reliable bottom reversal signals.
The Bullish Three Recovering Crows features three bearish candles where each opens within the prior candle's body and the bodies get progressively smaller, signaling that selling pressure is exhausting itself and a reversal may be imminent.
Three Stars in the South is a rare bullish reversal pattern of three progressively smaller bearish candles, each with shorter lower shadows and higher lows, signaling that selling pressure is systematically diminishing.
Three White Soldiers is one of the strongest bullish reversal patterns: three consecutive long bullish candles with progressively higher closes, each opening within the prior candle's body, signaling a powerful shift from bearish to bullish sentiment.
Pro Tips & Common Mistakes
Pro Tips
- The three descending candles should be orderly and of similar size — chaotic selling is not a ladder
- The fourth candle's upper shadow is the critical exhaustion signal — without it, the pattern is incomplete
- Volume declining through the descent and surging on the reversal is the ideal volume signature
- This is a five-candle pattern — don't try to shortcut it by entering before candle 5 confirms
- Use the pattern's total height as a measured-move target
Common Mistakes
- Identifying the pattern without the proper exhaustion candle (fourth candle)
- Entering before the fifth candle confirms the reversal
- Not requiring three consecutive bearish candles for the descent
- Confusing the pattern with a simple three black crows followed by a reversal
- Using too-tight stops that don't account for the pattern's wide range
Advanced Techniques
- Measure the decline rate across the three bearish candles — decelerating decline strengthens the signal
- Use the fourth candle's upper shadow high as an early resistance indicator
- Combine with Elliott Wave analysis to confirm the ladder bottom is at a wave terminal point
- Apply Heikin Ashi to better visualize the momentum shift across the five candles
Institutional Perspective
The orderly nature of the three-candle descent often reflects systematic selling (index rebalancing, fund outflows). Institutions recognize that systematic selling has a finite duration and use the exhaustion signal to time their entry.
Fun Facts
- The Ladder Bottom is one of the few five-candle patterns in Japanese candlestick analysis.
- The visual metaphor of 'climbing down and back up a ladder' makes this one of the most intuitively named patterns.
- Despite being less popular than simpler patterns, the Ladder Bottom's structured approach to identifying reversals makes it valuable for systematic traders.
Frequently Asked Questions
A five-candle bullish reversal where three consecutive bearish candles descend like rungs of a ladder, followed by an exhaustion candle with a long upper shadow, and a confirming bullish candle.
Moderate reliability (55% win rate). It works best at support levels with volume confirmation.