Overview
Bullish Key Reversal
Also known as: Key Reversal Day, Outside Reversal Day, Key Bottom Reversal
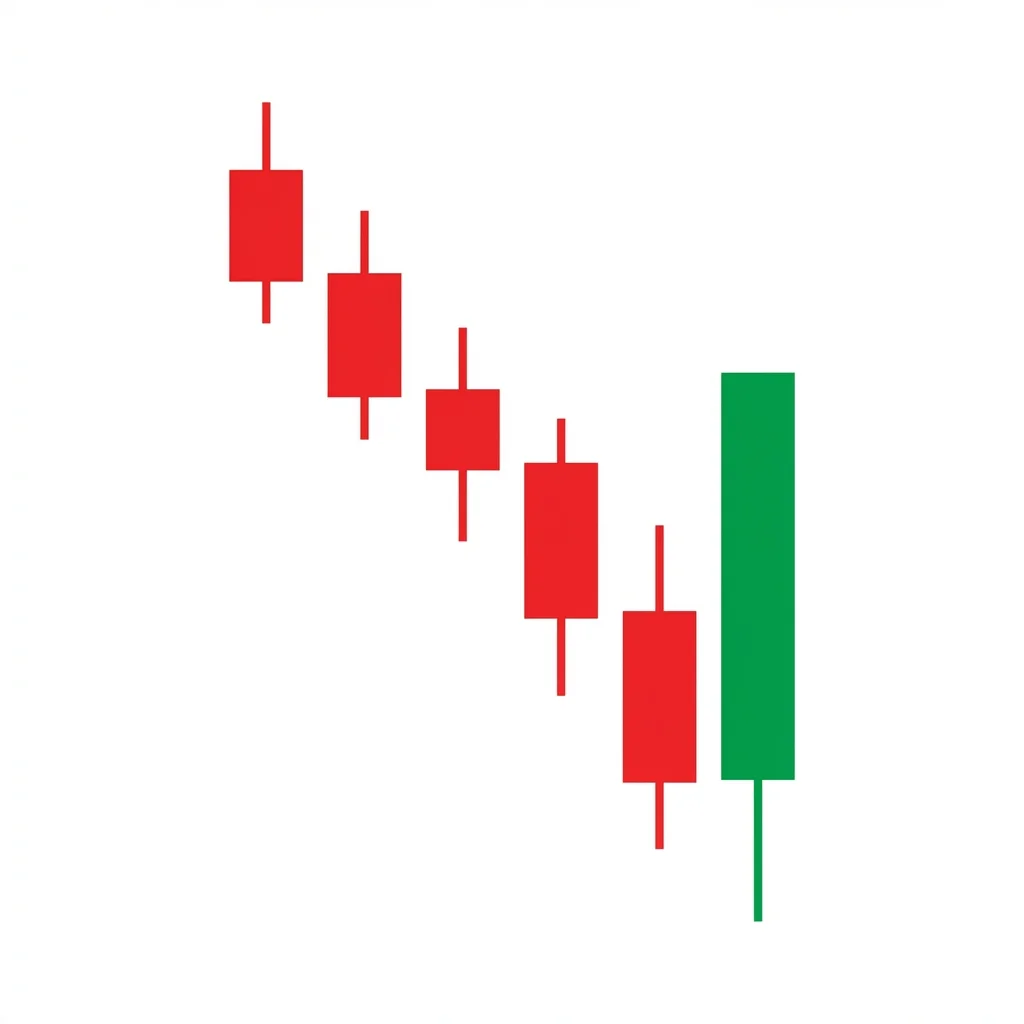
A Bullish Key Reversal occurs when price makes a new low during a downtrend but reverses to close above the prior bar's high on heavy volume, signaling a dramatic single-day shift in control from sellers to buyers.
The Key Reversal Day is one of the most powerful single-bar reversal signals. During a downtrend, price opens and initially extends lower, creating a new low that traps bears. Then, intraday buying pressure overwhelms sellers, reversing the bar to close above the prior day's high. The wide range combined with heavy volume indicates that a major shift in sentiment has occurred within a single session. This pattern is essentially a combined outside bar and reversal bar, making it one of the most reliable single-candle reversal signals available.
History & Etymology
The Key Reversal Day has been a staple of bar chart analysis since the early 20th century. It was described by Richard Wyckoff and later by Edwards and Magee. It predates candlestick analysis in the Western tradition and remains one of the most respected reversal signals among professional traders.
The word 'key' refers to the pattern's significance as a pivotal turning point. The reversal is 'key' because it often marks the exact session where the trend changes direction.
How It Forms
Formation Steps
- 1Price opens and trades below the prior day's low (making a new low)
- 2Price reverses during the session and closes above the prior day's high
- 3Heavy volume accompanies the reversal
Prerequisites
- Established downtrend
- The bar must make a lower low than the prior bar
- The bar must close above the prior bar's high
Confirmation Signals
- Volume is significantly above average
- Next bar follows through higher
- RSI shows bullish divergence
Invalidation Signals
- Low volume on the reversal day
- Price fails to follow through the next day
- Immediate close below the reversal bar's midpoint
Candle Breakdown
Key Reversal Bar
A wide-range bar that makes a new low below the prior bar but closes above the prior bar's high, on heavy volume
Bears initially push price to new lows, triggering panic selling. But buyers overwhelm them intraday, creating a massive reversal. The volume confirms the genuine shift in control.
Psychology
The Key Reversal captures a complete sentiment shift in one session. Bears push to new lows with confidence, but aggressive buying absorbs all selling and reverses the market. The dramatic nature of the single-session reversal creates lasting psychological impact.
Buyer Perspective
Buyers who were waiting for a capitulation signal see the failed new low as their entry point. Aggressive buying into the low traps shorts and triggers a powerful reversal.
Seller Perspective
Sellers who pushed to new lows are shocked by the reversal. Their confidence turns to panic as their positions go underwater within the same session.
Smart Money Action
Institutions often engineer the push to new lows to trigger retail stop-losses, then aggressively buy the liquidity. The key reversal is the visible result of this accumulation.
Retail Trader Trap
Retail traders who sold the new low or had stops triggered below support are the primary victims. Their selling provides the liquidity institutions need to accumulate.
Emotional Cycle
Trading Strategy
Aggressive Entry
Enter at the close of the key reversal bar.
Conservative Entry
Enter on the next bar's open after confirming the key reversal close.
Previous swing high or 1:1 R:R.
2:1 R:R or next resistance zone.
Measured move equal to the key reversal bar's range projected upward.
Best Conditions
- Timeframe: daily
- Timeframe: weekly
- oversold conditions
- at major support
- after extended selloff
- Asset: stocks
- Asset: indices
- Asset: futures
- Asset: commodities
Avoid When
- Timeframe: 1m
- Timeframe: 5m
- low liquidity
- holiday markets
- gradual decline without momentum
Confluence Factors
- Major support level
- Volume climax
- RSI bullish divergence
- 200-day MA support
- Fibonacci support level
Scale In Strategy
Enter full position on the key reversal — the signal is binary and immediate.
Scale Out Strategy
Take one-third at TP1, one-third at TP2, trail the remainder.
Risk Management
Volume Analysis
Volume Confirmation
Volume must be significantly above average — ideally 2x or more. Low-volume key reversals are unreliable.
Volume Profile
The heaviest volume should occur at the low of the bar (capitulation) and during the reversal rally.
Volume Divergence
Without heavy volume, the pattern loses most of its significance.
Technical Confluence
Support Resistance
Most powerful at major support levels where the new low tests and holds support before reversing.
Fibonacci Levels
Key reversals at the 61.8% or 78.6% retracement levels are exceptionally reliable.
Moving Averages
A key reversal that touches or pierces the 200-day MA before closing above it is a textbook setup.
Rsi Confirmation
RSI bullish divergence (RSI higher while price lower) on the reversal day is strong confirmation.
Macd Confirmation
MACD bullish crossover on the reversal day adds momentum confirmation.
Bollinger Bands
Key reversal piercing the lower band then closing within is a mean-reversion confirmation.
Vwap
Reclaiming the session VWAP during the reversal is important for intraday confirmation.
Ichimoku Cloud
A key reversal at Kumo cloud support with a close above the Tenkan-sen is bullish.
Elliott Wave
Commonly marks the end of Wave 5 or Wave C terminal points.
Wyckoff Phase
The key reversal bar often represents the selling climax in Wyckoff accumulation.
Market Profile
The new low creates a poor low (single print) that is quickly rejected — a strong reversal signal.
Order Flow
Massive buy absorption at the low, followed by aggressive buying that drives the close above the prior high.
Open Interest
Declining open interest on the reversal day suggests short covering is driving the move.
Multi-Timeframe Analysis
Higher Timeframe Alignment
A daily key reversal at a weekly support level is among the strongest setups.
Lower Timeframe Entry
After the daily key reversal, the 4H chart often shows a double bottom or V-recovery for precision entry.
Timeframe Confluence
Key reversals visible on both daily and weekly timeframes are exceptionally rare and powerful.
Top-Down Approach
Identify weekly support, wait for the daily key reversal, confirm with 4H price action.
Statistics
Historical Examples
Crude Oil Key Reversal
successCrude oil formed a massive key reversal after the historic negative price event. Price made new lows then reversed sharply on record volume.
Lesson: Key reversals at extreme price levels on record volume often mark generational bottoms.
S&P 500 Key Reversal at 200-DMA
successThe S&P 500 made a new low in the December 2018 selloff, then reversed sharply to close above the prior day's high. This marked the exact bottom.
Lesson: Key reversals at the end of rapid selloffs often produce V-shaped recoveries.
Variations
Weekly Key Reversal
A key reversal on the weekly chart — an extremely powerful signal.
Key Reversal with Gap
The session gaps down before reversing to close above the prior bar's high.
Confusion Matrix
Patterns commonly confused with Bullish Key Reversal and how to distinguish them.
Bullish Outside Reversal
9000% similarA key reversal is a specific type of outside reversal that makes a new low in the trend. All key reversals are outside reversals, but not all outside reversals are key reversals.
Key Differences
- Key reversal requires a new low AND close above prior high
- Outside reversal may not make a new low
The bearish key reversal is a powerful single-bar reversal pattern where price makes a new high then reverses to close below the prior bar's low on high volume, signaling a decisive shift from buying to selling control.
The Bullish Engulfing is one of the most popular and reliable two-candle reversal patterns. A large bullish candle completely engulfs the prior bearish candle body, signaling a decisive shift from selling to buying control.
The Morning Star is a three-candle bullish reversal pattern consisting of a large bearish candle, a small star candle showing indecision, and a large bullish candle confirming the reversal. It is one of the most widely recognized and reliable bottom reversal signals.
The Bullish Outside Reversal is a two-bar pattern where the second bar has a wider range than the first, trading both below its low and above its high before closing bullish. This dramatic range expansion signals a powerful shift from bearish to bullish control.
The Bearish Belt Hold is a single bearish candle that opens at its high and closes near its low with a long body, indicating that sellers dominated from the opening bell and controlled price action throughout the session.
The Bearish Closing Marubozu is a single bearish candle with no lower shadow — the close is at the exact low of the session. This indicates that sellers controlled the session and maintained pressure through the very last trade, a sign of strong bearish conviction.
Pro Tips & Common Mistakes
Pro Tips
- Volume is the most critical confirmation — a key reversal without heavy volume is just noise
- The wider the range of the reversal bar, the stronger the signal
- The pattern is most powerful when the new low penetrates a well-known support level before reversing
- Look for the reversal to close in the upper 25% of its range for maximum strength
- This pattern works especially well in commodities and futures where volume data is reliable
Common Mistakes
- Ignoring the volume requirement — this is the most common error
- Confusing any large green candle during a downtrend with a key reversal
- Not requiring the new low (below the prior bar's low) before the reversal
- Using the pattern on very short timeframes where it loses significance
- Not having a clear prior downtrend — the pattern requires trend context
Advanced Techniques
- Combine with market profile — a poor low (single print) at the bar's bottom confirms rejection
- Use tick-by-tick data to identify the exact moment of reversal within the session
- Look for key reversals across correlated markets simultaneously for stronger conviction
- Use the key reversal bar's high-low range as the measured move target
Institutional Perspective
The Key Reversal Day is one of the patterns most respected by institutional traders. The combination of new lows and strong close indicates that large players are aggressively accumulating. Many quantitative funds include key reversal days in their systematic trading models.
Fun Facts
- The Key Reversal Day is one of the oldest named patterns in Western technical analysis, predating candlestick analysis by decades.
- Many of the most famous market bottoms in history featured key reversal days — including the 1987 crash bottom and the 2009 financial crisis low.
- Professional floor traders in the pit era considered the key reversal day one of their most reliable signals.
Frequently Asked Questions
A Key Reversal Day specifically requires three elements: a new low below the prior bar, a close above the prior bar's high, and heavy volume. This combination makes it one of the strongest single-bar reversal signals.
Heavy volume confirms that the reversal involved genuine participation from large players. Without volume, the price action may just be random noise in a low-liquidity environment.