Overview
Bullish Three Recovering Crows
Also known as: Recovering Crows, Three Crows Reversal
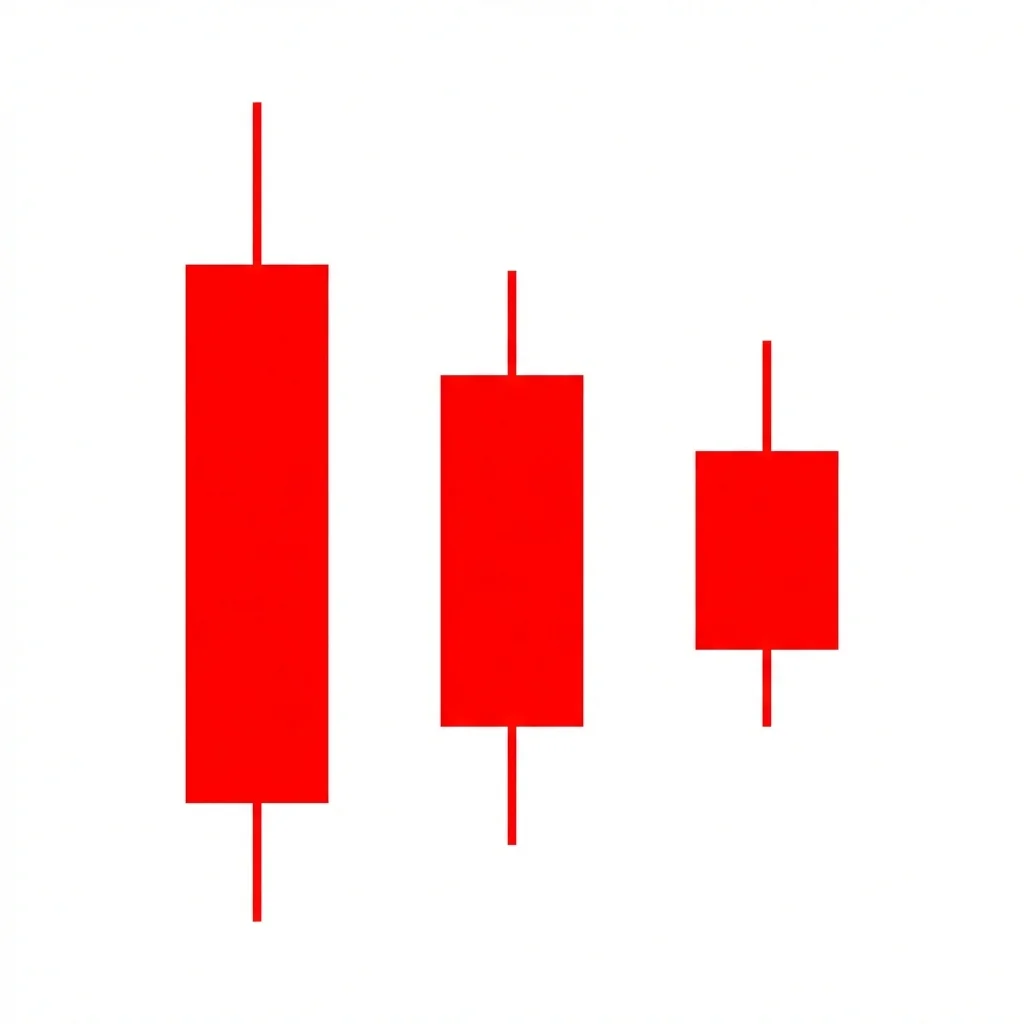
The Bullish Three Recovering Crows features three bearish candles where each opens within the prior candle's body and the bodies get progressively smaller, signaling that selling pressure is exhausting itself and a reversal may be imminent.
This pattern shows three consecutive bearish candles, but unlike the ominous Three Black Crows (which signal continuation), the Recovering Crows show diminishing momentum. Each candle opens higher (within the prior candle's body) rather than at the prior close or below it, and the real bodies shrink. This progressive weakening of selling pressure suggests that bears are running out of steam and buyers are beginning to absorb the supply. A bullish confirmation candle after the pattern completes the reversal signal.
History & Etymology
The Three Recovering Crows is a lesser-known variant documented in comprehensive Japanese candlestick references. It contrasts with the Three Black Crows continuation pattern by emphasizing the diminishing nature of each bearish candle.
Named as a counterpart to Three Black Crows. While crows symbolize bearishness in Japanese candlestick lore, 'recovering' crows indicate that the bearish force is weakening and recovery is approaching.
How It Forms
Formation Steps
- 1First candle: a long bearish candle in a downtrend
- 2Second candle: a bearish candle that opens within the first candle's body and closes lower
- 3Third candle: a bearish candle that opens within the second candle's body and closes lower, but the candles are progressively smaller
Prerequisites
- Established downtrend
- Each candle opens within the prior candle's real body
- Bodies progressively get smaller, showing diminishing selling pressure
Confirmation Signals
- Next candle is bullish and closes above the third candle's open
- Volume declines across the three candles
- RSI shows bullish divergence
Invalidation Signals
- Fourth candle continues lower with strong selling
- Volume increases on each candle
- No bullish candle follows the pattern
Candle Breakdown
First Crow
A long bearish candle in the downtrend with strong selling volume
Strong selling continues the downtrend. Bears appear firmly in control.
Second Crow
A bearish candle that opens within the first candle's body and has a smaller body
Selling continues but the higher open shows overnight buying interest. The smaller body indicates reduced conviction.
Third Crow
The smallest bearish candle, opening within the second candle's body
Selling pressure is nearly exhausted. The small body and low volume show bears have little remaining conviction.
Psychology
The Recovering Crows show selling pressure diminishing candle by candle. Each session opens higher (within the prior body) and makes less downside progress, indicating that supply is being absorbed and a reversal is brewing.
Buyer Perspective
Buyers recognize the diminishing bearish candles as a sign that selling is exhausting. They begin placing orders, anticipating a reversal.
Seller Perspective
Sellers notice their candles getting smaller and their momentum fading. Some begin covering positions, reducing downside pressure further.
Smart Money Action
Institutions use the diminishing sell pressure to quietly accumulate positions across the three candles, building a position before the reversal.
Retail Trader Trap
Retail traders see three bearish candles and assume the downtrend is strong, missing the key signal of diminishing size and momentum.
Emotional Cycle
Trading Strategy
Aggressive Entry
Enter long at the close of the third candle when the diminishing pattern is clear.
Conservative Entry
Wait for a bullish confirmation candle that closes above the third candle's open.
First candle's open (top of the pattern).
1:1 risk-reward ratio.
Previous swing high or 2:1 R:R.
Best Conditions
- Timeframe: daily
- Timeframe: 4h
- oversold conditions
- at support levels
- after extended declines
- Asset: stocks
- Asset: forex
- Asset: ETFs
Avoid When
- Timeframe: 1m
- Timeframe: 5m
- strong bear trend
- deteriorating fundamentals
- panic selling
Confluence Factors
- Pattern at support
- RSI divergence
- Declining volume
- Near moving average support
- Fibonacci alignment
Scale In Strategy
Enter half on pattern completion, add on confirmation.
Scale Out Strategy
Take half at first target, trail the rest.
Risk Management
Volume Analysis
Volume Confirmation
Declining volume across the three candles confirms diminishing selling pressure.
Volume Profile
Volume should decrease from candle 1 to candle 3.
Volume Divergence
Increasing volume on the crows suggests genuine, not diminishing, selling.
Technical Confluence
Support Resistance
Most effective at established support levels.
Fibonacci Levels
Pattern at 61.8% retracement adds significance.
Moving Averages
Pattern near the 50 or 200-day MA increases reliability.
Rsi Confirmation
RSI bullish divergence across the three candles is the strongest confirmation.
Macd Confirmation
MACD histogram contracting (less negative) across the three candles confirms diminishing momentum.
Bollinger Bands
Pattern at the lower Bollinger Band suggests oversold conditions.
Vwap
Pattern near VWAP provides institutional support reference.
Ichimoku Cloud
Pattern below the cloud with signs of recovery toward Tenkan-sen.
Elliott Wave
May appear at the end of Wave 5 or Wave C terminations.
Wyckoff Phase
Can occur during the selling climax or automatic reaction phases.
Market Profile
Pattern at Value Area Low adds significance.
Order Flow
Decreasing aggressive selling across each candle visible in delta data.
Open Interest
Stable or declining OI suggests selling exhaustion.
Multi-Timeframe Analysis
Higher Timeframe Alignment
Weekly support with daily recovering crows provides the strongest setup.
Lower Timeframe Entry
Use 4-hour charts to time the entry after the daily pattern completes.
Timeframe Confluence
Weekly support, daily pattern, 4-hour confirmation.
Top-Down Approach
Weekly support, daily pattern identification, intraday entry timing.
Statistics
Historical Examples
JPM Diminishing Selling
successJPM showed three diminishing bearish candles at $110 support with declining volume. A bullish engulfing on the fourth day confirmed the reversal.
Lesson: When combined with clear support and declining volume, the pattern provides a reliable reversal signal.
AUD/USD Recovery
partialAUD/USD formed recovering crows near 0.6600 with diminishing bodies. The bounce was modest before consolidation.
Lesson: In forex, the pattern may produce smaller bounces — manage expectations.
Failed Recovery
failureMETA showed what appeared to be recovering crows but the selling accelerated after earnings. The pattern was invalidated.
Lesson: Fundamental catalysts can override technical patterns. Always check for upcoming events.
Variations
Three Stars in the South
A more formally defined version where each candle has a shorter lower shadow and smaller body.
Confusion Matrix
Patterns commonly confused with Bullish Three Recovering Crows and how to distinguish them.
Bearish Three Black Crows
7000% similarCheck body size progression and opening positions. Diminishing bodies with opens inside prior body = Recovering Crows. Equal/growing bodies = Three Black Crows.
Key Differences
- Three Black Crows have same-size or growing bodies with lower opens
- Recovering Crows have diminishing bodies with higher opens
The Bearish Advance Block shows three consecutive bullish candles with progressively smaller bodies and longer upper shadows, signaling that buying momentum is weakening and a reversal or consolidation is likely.
The Bullish Engulfing is one of the most popular and reliable two-candle reversal patterns. A large bullish candle completely engulfs the prior bearish candle body, signaling a decisive shift from selling to buying control.
The Ladder Bottom is a five-candle bullish reversal pattern where three descending bearish candles are followed by an exhaustion signal and a confirming bullish candle, resembling climbing down and then back up a ladder.
The Matching Low is a two-candle bullish reversal pattern where two consecutive bearish candles close at the same price, indicating a support level that sellers cannot breach.
Three Stars in the South is a rare bullish reversal pattern of three progressively smaller bearish candles, each with shorter lower shadows and higher lows, signaling that selling pressure is systematically diminishing.
The Bearish Abandoned Baby is one of the rarest and most reliable top reversal patterns in candlestick analysis. It features a doji that is completely isolated by gaps on both sides, signaling an abrupt and dramatic shift from buying to selling pressure.
Pro Tips & Common Mistakes
Pro Tips
- The key signal is diminishing body size — each crow should be noticeably smaller than the last
- Volume MUST decline across the three candles for the pattern to be valid
- Always wait for a bullish confirmation candle — the three crows alone are not an entry signal
- Combine with RSI divergence for significantly higher win rates
- This is a moderate-reliability pattern — use it as supporting evidence rather than a standalone signal
Common Mistakes
- Confusing with Three Black Crows, which is a bearish continuation pattern
- Not verifying that bodies are diminishing
- Entering without a bullish confirmation candle
- Ignoring volume — the pattern requires declining volume
- Trading against a strong bear trend without support confluence
Advanced Techniques
- Combine with Three Stars in the South for a stronger version of the same concept
- Use order flow to verify diminishing sell-side aggression
- Apply volume profile to confirm the pattern at a high-volume support node
- Use the pattern as a component in Wyckoff accumulation analysis
Institutional Perspective
The diminishing nature of each bearish candle signals that institutional selling is complete. Smart money may be absorbing the residual selling, building positions for the reversal.
Fun Facts
- The Recovering Crows pattern is one of the rarest candlestick patterns, appearing in less than 1% of chart formations.
- Japanese traders viewed diminishing crows as a positive omen — the crows are flying away, taking the bad luck with them.
- The pattern is essentially the inverse of the Advance Block pattern seen at market tops.
Frequently Asked Questions
Three consecutive bearish candles where each opens within the prior candle's body and the bodies get progressively smaller, signaling that selling pressure is exhausting and a reversal may follow.
Three Black Crows have equal or growing bodies with each candle opening at or near the prior close (strong continuation). Recovering Crows have diminishing bodies with opens inside the prior body (weakening selling).