Overview
Bullish Three Stars in the South
Minami no Sansei (南の三星)
Also known as: Three Stars South, Southern Three Stars
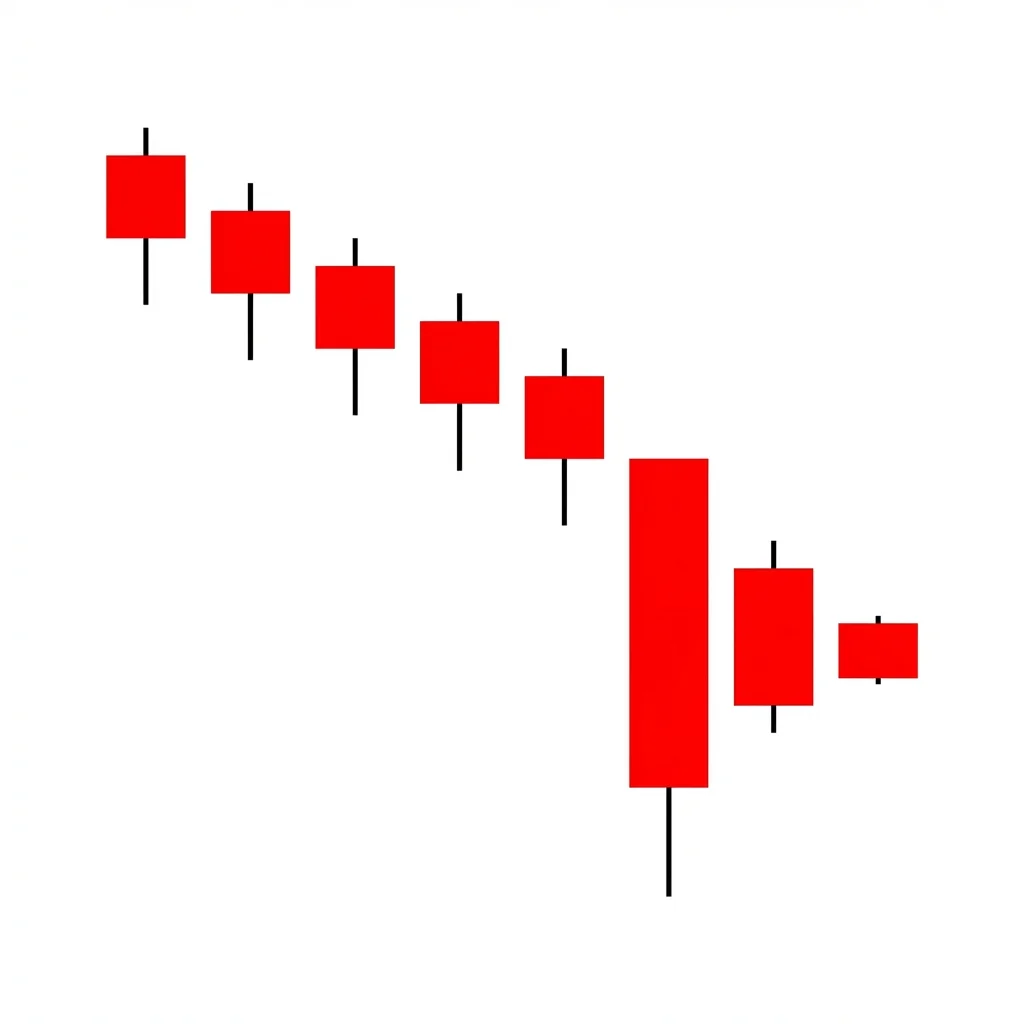
Three Stars in the South is a rare bullish reversal pattern of three progressively smaller bearish candles, each with shorter lower shadows and higher lows, signaling that selling pressure is systematically diminishing.
This highly specific pattern shows three bearish candles where each candle is smaller than the previous one, each lower shadow is shorter, and each low is higher. The progressive diminishment of bearish characteristics — smaller bodies, shorter shadows, and higher lows — signals that sellers are running out of steam in a very orderly fashion. The third candle, a small marubozu contained within the second candle's range, shows the final exhaustion of selling. This is one of the rarest patterns in candlestick analysis.
History & Etymology
Three Stars in the South originates from traditional Japanese candlestick analysis. It is one of the most formally defined patterns, with specific requirements for body size, shadow length, and range containment. Its rarity makes it one of the least studied but most precisely defined patterns.
The name references three stars (candles) appearing in the south (bottom/lower area of the chart). In Japanese astronomy and culture, southern stars near the horizon signaled a coming change in weather — similarly, these three stars near the bottom signal a coming change in trend.
How It Forms
Formation Steps
- 1First candle: a long bearish candle with a long lower shadow
- 2Second candle: a bearish candle similar to the first but with a shorter body and a higher low (shorter lower shadow)
- 3Third candle: a small bearish marubozu (no shadows) that is entirely within the second candle's range
Prerequisites
- Established downtrend
- Each candle gets progressively smaller
- Each candle's low is higher than the previous candle's low
- The third candle is contained within the second candle's range
Confirmation Signals
- Fourth candle is bullish and closes above the first candle's midpoint
- Volume declines across the three candles
- RSI shows bullish divergence
Invalidation Signals
- Price continues lower after the pattern
- Volume increases on bearish candles
- Fourth candle is bearish
Candle Breakdown
First Star
A long bearish candle with a notable long lower shadow, showing selling that was partially rejected
Strong selling but the long lower shadow shows buyers absorbed some of the selling at the lows.
Second Star
A shorter bearish candle with a shorter lower shadow, opening within the first candle's body with a higher low
Selling continues but with less force. The shorter shadow and higher low show sellers are losing ground.
Third Star
A small bearish marubozu with no shadows, contained entirely within the second candle's range
Selling has nearly stopped. The tiny body with no shadows shows complete loss of bearish momentum.
Psychology
Three Stars in the South shows systematic exhaustion of selling pressure over three sessions. Each candle demonstrates less bearish conviction than the previous one, culminating in a near-neutral state that precedes a reversal.
Buyer Perspective
Buyers see the progressive weakening of each bearish candle as clear evidence that selling is exhausting. They prepare to enter on the next bullish signal.
Seller Perspective
Sellers notice their candles shrinking session after session. By the third candle, they have virtually no momentum left and many have already covered.
Smart Money Action
Institutions absorb selling across all three candles, building positions as the price of supply decreases. The third candle represents near-complete absorption.
Retail Trader Trap
Retail traders may see three bearish candles and assume continued downtrend, missing the critical diminishing nature of each one.
Emotional Cycle
Trading Strategy
Aggressive Entry
Enter long at the close of the third candle when the diminishing pattern is clear.
Conservative Entry
Wait for a bullish fourth candle closing above the first candle's midpoint.
First candle's open.
1:1 risk-reward.
Previous swing high.
Best Conditions
- Timeframe: daily
- Timeframe: weekly
- at support
- after extended decline
- oversold conditions
- Asset: stocks
- Asset: forex
Avoid When
- Timeframe: 1m
- Timeframe: 5m
- Timeframe: 15m
- strong bear trend
- deteriorating fundamentals
Confluence Factors
- At major support
- RSI divergence
- Declining volume
- Fibonacci alignment
- Oversold indicators
Scale In Strategy
Enter on pattern completion, add on confirmation.
Scale Out Strategy
Take half at first target, trail the rest.
Risk Management
Volume Analysis
Volume Confirmation
Volume declining across all three candles is essential.
Volume Profile
Each candle should show less volume than the prior one.
Volume Divergence
Increasing volume invalidates the exhaustion thesis.
Technical Confluence
Support Resistance
Pattern at established support is highly significant.
Fibonacci Levels
First candle's shadow testing a Fibonacci level adds confluence.
Moving Averages
Pattern near the 200-day MA adds institutional interest.
Rsi Confirmation
RSI making higher lows across the three candles while price makes lower closes is classic bullish divergence.
Macd Confirmation
MACD histogram becoming less negative across the three candles.
Bollinger Bands
Pattern near or below the lower Bollinger Band.
Vwap
Pattern near VWAP provides institutional reference.
Ichimoku Cloud
Below the cloud with signs of exhaustion.
Elliott Wave
May mark the end of Wave 5 or Wave C.
Wyckoff Phase
Can appear during selling climax or automatic reaction.
Market Profile
Pattern at Value Area Low.
Order Flow
Progressively weaker sell-side delta.
Open Interest
Stable or declining OI confirms exhaustion.
Multi-Timeframe Analysis
Higher Timeframe Alignment
Weekly support with daily pattern.
Lower Timeframe Entry
4-hour chart for entry timing.
Timeframe Confluence
Weekly support, daily pattern, 4-hour entry.
Top-Down Approach
Higher timeframe support, daily pattern, lower timeframe entry.
Statistics
Historical Examples
WMT Exhaustion Pattern
successWMT showed three progressively smaller bearish candles with diminishing shadows at $120 support. A bullish engulfing on day four confirmed the reversal.
Lesson: Defensive stocks at major support can produce reliable Three Stars South patterns.
Failed Pattern
failurePYPL showed diminishing candles but the fundamental outlook was deteriorating. The pattern failed to produce a reversal.
Lesson: Even precisely defined patterns fail when fundamentals are against the trade.
Variations
Approximate Three Stars South
The pattern meets most but not all strict requirements — slightly less formal.
Confusion Matrix
Patterns commonly confused with Bullish Three Stars in the South and how to distinguish them.
Bullish Three Recovering Crows
8000% similarThree Stars South requires specifically shorter lower shadows on each candle and a marubozu third candle. Recovering Crows has less strict requirements.
Key Differences
- Three Stars South has specific shadow and body requirements (diminishing shadows, marubozu third candle)
- Recovering Crows has less formal requirements
The Bearish Advance Block shows three consecutive bullish candles with progressively smaller bodies and longer upper shadows, signaling that buying momentum is weakening and a reversal or consolidation is likely.
The Bullish Engulfing is one of the most popular and reliable two-candle reversal patterns. A large bullish candle completely engulfs the prior bearish candle body, signaling a decisive shift from selling to buying control.
The Ladder Bottom is a five-candle bullish reversal pattern where three descending bearish candles are followed by an exhaustion signal and a confirming bullish candle, resembling climbing down and then back up a ladder.
The Morning Star is a three-candle bullish reversal pattern consisting of a large bearish candle, a small star candle showing indecision, and a large bullish candle confirming the reversal. It is one of the most widely recognized and reliable bottom reversal signals.
The Bullish Three Recovering Crows features three bearish candles where each opens within the prior candle's body and the bodies get progressively smaller, signaling that selling pressure is exhausting itself and a reversal may be imminent.
The Bearish Abandoned Baby is one of the rarest and most reliable top reversal patterns in candlestick analysis. It features a doji that is completely isolated by gaps on both sides, signaling an abrupt and dramatic shift from buying to selling pressure.
Pro Tips & Common Mistakes
Pro Tips
- One of the rarest patterns in existence — its appearance warrants serious attention
- The progressive shortening of lower shadows is the key distinguishing feature
- The third candle being a marubozu (no shadows) is a strict requirement in the formal definition
- Volume must decline across all three candles for the pattern to be valid
- Always wait for a bullish confirmation candle given the pattern's moderate base reliability
Common Mistakes
- Not recognizing the pattern due to extreme rarity
- Accepting candles that do not meet the strict formal requirements
- Entering without confirmation
- Ignoring declining volume requirement
- Confusing with standard three bearish candles
Advanced Techniques
- Use the pattern as a component in a broader Wyckoff accumulation analysis
- Combine with RSI divergence for significantly higher confidence
- Apply volume profile to confirm demand at the pattern level
- Track the pattern in conjunction with institutional flow data
Institutional Perspective
The progressive reduction in selling visible in this pattern reflects institutional absorption of supply. By the third candle, virtually all motivated sellers have been cleared, setting the stage for markup.
Fun Facts
- Three Stars in the South may be the rarest formally defined candlestick pattern, with some traders reporting never seeing one in decades of chart analysis.
- The southern reference in the name connects to the bottom of the chart, where hope emerges like stars in the southern sky.
- Despite its rarity, the pattern is included in every comprehensive candlestick reference as a testament to the precision of Japanese pattern classification.
Frequently Asked Questions
An extremely rare three-candle reversal pattern where each bearish candle is progressively smaller with shorter lower shadows and higher lows, signaling systematic selling exhaustion.
One of the rarest candlestick patterns in existence. Its strict formation requirements mean it appears in less than 0.5% of chart formations.