Overview
Bullish Measured Move Up
Also known as: AB=CD Pattern, Swing Measured Move, Equal Legs Move
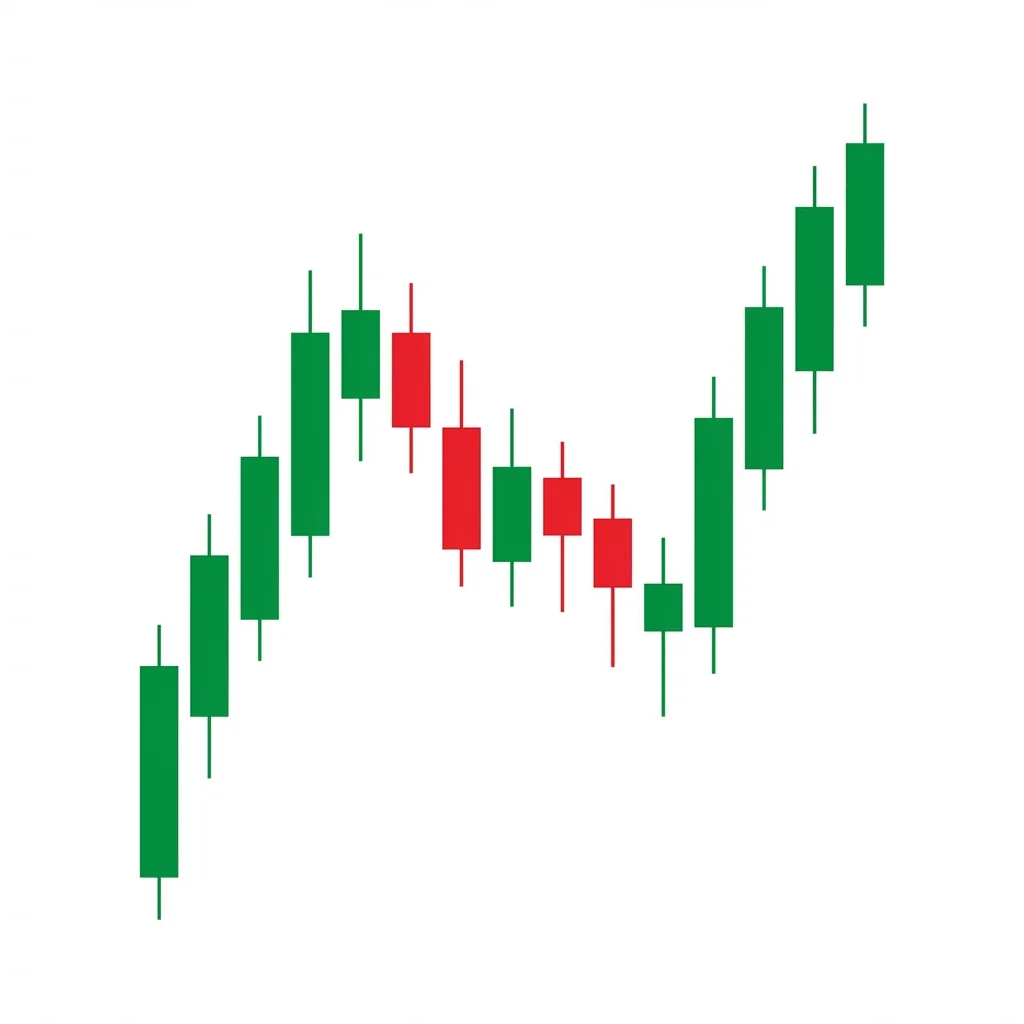
The Measured Move Up is a bullish pattern where two rally legs of approximately equal length are separated by a correction, allowing traders to project the second leg's target by measuring the first leg's distance.
The Measured Move Up (also known as the AB=CD pattern) is one of the most practical patterns in technical analysis because it provides a specific, measurable price target. The pattern consists of three phases: an initial advance (A to B), a correction (B to C), and a second advance (C to D) that is approximately equal in distance to the first leg. The concept is that markets tend to move in measured, proportional swings. By measuring the first leg and projecting that distance from the correction low, traders can estimate where the second leg will terminate. This pattern is a cornerstone of both traditional technical analysis and harmonic trading.
History & Etymology
The concept of measured moves has been part of technical analysis since Charles Dow. The AB=CD formalization was developed by H.M. Gartley in his 1935 book 'Profits in the Stock Market' and later refined by Scott Carney in his work on harmonic patterns.
The name describes the pattern literally: a 'measured move' where the second rally leg can be measured using the first leg as a reference. The equal-legs concept gives it the AB=CD notation.
How It Forms
Formation Steps
- 1First leg (A to B): an initial bullish advance
- 2Correction (B to C): a pullback that retraces part of the first leg
- 3Second leg (C to D): a bullish advance roughly equal in length to the first leg
Prerequisites
- A clear first bullish leg must be identifiable
- A corrective pullback follows the first leg
- The correction should retrace 38.2-61.8% of the first leg
Confirmation Signals
- Price begins to advance from point C
- Volume increases on the second leg
- The advance from C approaches the measured target at D
Invalidation Signals
- Price breaks below point A (the starting point)
- The correction exceeds 78.6% of the first leg
- The second leg fails to reach at least 75% of the first leg's distance
Candle Breakdown
Point A (Origin)
The starting point of the first rally leg
The advance begins — buyers initiate the move.
Point B (First Leg High)
The peak of the first rally leg
Profit-taking begins after the first advance. A correction is needed.
Point C (Correction Low)
The low of the correction, from which the second leg launches
The correction ends and buyers re-enter. This is the entry point for the measured move trade.
Psychology
Markets move in proportional swings due to the rhythmic nature of buying and selling cycles. The first leg represents the initial impulse, the correction represents profit-taking, and the second leg represents renewed buying with equal enthusiasm.
Buyer Perspective
Buyers who missed the first leg see the correction as their entry opportunity. Their buying creates the second leg, which tends to mirror the first in magnitude.
Seller Perspective
Sellers who profit-took at point B re-enter as buyers at point C if the correction is orderly. Their renewed buying helps drive the second leg.
Smart Money Action
Institutions buy the correction at point C, knowing the market's tendency to move in measured swings. They set their targets at D (AB=CD completion).
Retail Trader Trap
Retail traders who sold the correction at point B-to-C are trapped when the second leg begins. Those who chase the second leg late often buy near the D target.
Emotional Cycle
Trading Strategy
Aggressive Entry
Enter long at point C (the correction low) with a stop below point A.
Conservative Entry
Enter when price breaks above point B (the first leg's high), confirming the second leg is underway.
The measured move target at point D (AB=CD completion).
1.27x AB extension from C.
1.618x AB extension from C.
Best Conditions
- Timeframe: daily
- Timeframe: 4h
- Timeframe: 1h
- Timeframe: weekly
- trending markets
- recovery rallies
- orderly uptrends
- Asset: stocks
- Asset: forex
- Asset: indices
- Asset: crypto
- Asset: commodities
Avoid When
- Timeframe: 1m
- choppy markets
- high volatility
- news-driven
Confluence Factors
- Fibonacci retracement at point C (38.2-61.8%)
- Support level at point C
- Volume decline during correction
- RSI reset during correction
- Moving average support at point C
Scale In Strategy
Enter at point C, add as the second leg begins to show momentum.
Scale Out Strategy
Take 50% at the AB=CD target, trail the rest.
Risk Management
Volume Analysis
Volume Confirmation
Volume should decrease during the correction and increase during the second leg.
Volume Profile
Similar volume pattern in both legs confirms the measured move thesis.
Volume Divergence
Lower volume on the second leg may mean it falls short of the target.
Technical Confluence
Support Resistance
Point C often forms at a prior support level, and point D often aligns with resistance.
Fibonacci Levels
The correction (B to C) typically retraces 38.2-61.8% of AB. The target (D) equals AB projected from C.
Moving Averages
Point C often bounces off the 20 or 50-period moving average.
Rsi Confirmation
RSI resetting from overbought to neutral during the correction, then rising again on the second leg.
Macd Confirmation
MACD pulling back during the correction without crossing bearish, then surging on the second leg.
Bollinger Bands
Correction to the middle band with the second leg reaching the upper band.
Vwap
Correction to VWAP with the second leg advancing above.
Ichimoku Cloud
Correction holding above the cloud confirms the uptrend context.
Elliott Wave
The measured move often corresponds to Waves 1-2-3 or 3-4-5 in Elliott Wave theory.
Wyckoff Phase
Can represent two markup moves separated by a brief re-accumulation.
Market Profile
The correction creates a balance area; the second leg breaks out initiative.
Order Flow
Buy imbalances return at point C, matching the pattern seen at point A.
Open Interest
Rising OI on the second leg confirms new money entering.
Multi-Timeframe Analysis
Higher Timeframe Alignment
A weekly measured move target that aligns with daily entries is the optimal setup.
Lower Timeframe Entry
Use the 1H chart to enter at point C with precision.
Timeframe Confluence
Measured move targets on multiple timeframes that converge create strong resistance/target zones.
Top-Down Approach
Identify the weekly AB=CD structure, enter on the daily at point C, target the weekly D point.
Statistics
Historical Examples
S&P 500 Post-COVID Measured Move
successThe S&P 500 rallied from 2,200 to 3,200 (first leg), corrected to 2,950, then rallied an equal distance to 3,950, almost perfectly matching the measured move target.
Lesson: Index-level measured moves can be remarkably precise, especially in recovery rallies.
EUR/USD AB=CD Pattern
successEUR/USD rallied 200 pips (A to B), corrected 80 pips to the 38.2% retracement, then rallied another 200 pips from C, completing the measured move target perfectly.
Lesson: Forex pairs are particularly responsive to measured moves and AB=CD patterns due to their rhythmic price behavior.
Variations
Extended Measured Move (1.27 AB=CD)
The second leg extends to 1.27x the first leg's distance.
Compressed Measured Move (0.786 AB=CD)
The second leg falls slightly short of the first leg's distance.
Confusion Matrix
Patterns commonly confused with Bullish Measured Move Up and how to distinguish them.
Bullish Flag
7000% similarThe measured move focuses on two equal rally legs. A flag focuses on the consolidation shape between the legs.
Key Differences
- The measured move is a broader concept covering two full legs
- A flag is specifically a tight consolidation within a trend
The measured move down is a two-leg decline pattern where the second leg is approximately equal in distance to the first, separated by a corrective phase. It provides a clear price target for the decline based on symmetry.
The Bullish ABC Bounce is a simple but powerful continuation pattern where price makes a three-wave corrective pullback within an uptrend before resuming higher. It is one of the most fundamental and frequently occurring patterns in all of technical analysis.
The Cup and Handle is one of the most reliable continuation patterns in technical analysis, featuring a rounded U-shaped base (cup) followed by a small pullback (handle) before a powerful breakout to new highs.
The Bullish Flag is the quintessential continuation pattern: a sharp rally (pole) followed by a brief, tight consolidation (flag) before the next leg up. It represents a healthy pause in a strong uptrend.
The Higher Lows pattern is the most fundamental bullish structure, showing that buyers are willing to step in at progressively higher prices, indicating strengthening demand and a healthy uptrend.
The Broadening Top (Megaphone) is a chart formation characterized by expanding price swings that create higher highs and lower lows, reflecting increasing volatility and instability at market tops before a bearish breakdown.
Pro Tips & Common Mistakes
Pro Tips
- The most reliable measured moves have corrections that retrace 38.2-61.8% of the first leg
- The AB=CD target is reached approximately 65-70% of the time, making it a reliable profit target
- Use Fibonacci extension tools to project the target: measure A to B, then project from C
- The time duration of the second leg often mirrors the first — both in price and time
- Combine the measured move target with other resistance levels for higher confidence
Common Mistakes
- Using the measured move as the only analysis tool without considering context
- Not adjusting the target when the correction is deeper or shallower than typical
- Entering too late in the second leg, degrading risk-reward
- Holding past the measured target hoping for more — the target is the target
- Not accounting for the correction depth when projecting the target
Advanced Techniques
- Use harmonic ratios: if BC = 0.618 of AB, then CD often equals 1.272 of BC
- Combine measured moves with time projections — if AB took 10 bars, CD often takes 10 bars
- Stack multiple measured move projections from different starting points for confluence zones
- Use the AB=CD completion as a take-profit zone AND a potential reversal zone
Institutional Perspective
Institutional traders and quant funds use measured move calculations in their systematic strategies. The pattern's mathematical precision appeals to quantitative approaches, and many algorithmic systems include AB=CD completion as profit targets and potential reversal zones.
Fun Facts
- H.M. Gartley first described the AB=CD pattern in 1935, making it one of the oldest formally documented chart patterns.
- The measured move concept is used across all financial markets and has been validated in academic studies.
- Many trading platforms have built-in AB=CD tools because the pattern is so widely used by professional traders.
Frequently Asked Questions
A Measured Move consists of two rally legs of approximately equal length separated by a correction. By measuring the first leg, you can project where the second leg will likely terminate.
The AB=CD target is reached approximately 65-70% of the time. Using the 1.27 and 1.618 extensions as alternative targets covers most outcomes.