Overview
Bullish Reaccumulation
Also known as: Wyckoff Reaccumulation, Continuation Accumulation, Stepping Stone
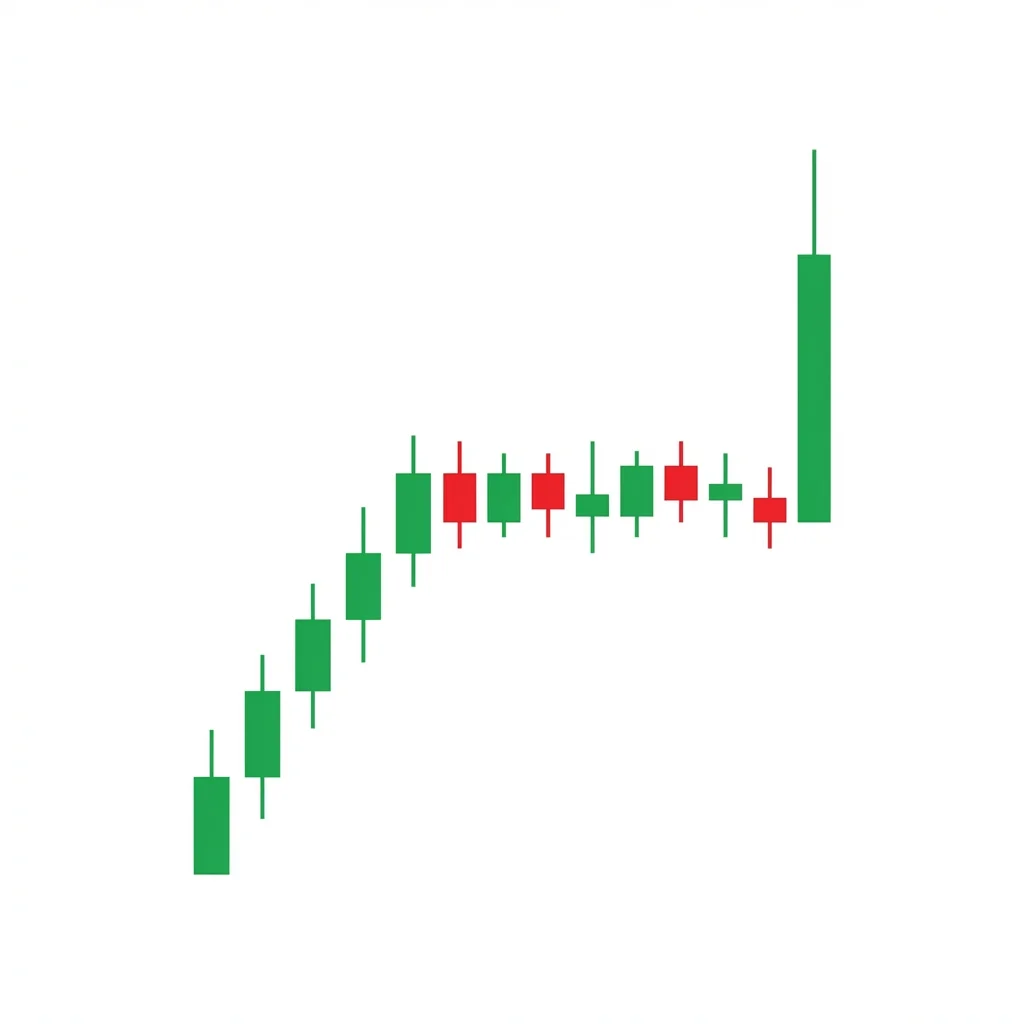
Bullish Reaccumulation is a Wyckoff continuation pattern where institutions pause an uptrend to absorb supply and build additional positions within a trading range before continuing the markup phase.
Reaccumulation occurs when a strong uptrend pauses in a trading range, appearing similar to distribution but ultimately resolving higher. Institutions use this consolidation to absorb selling from profit-takers and build additional long positions. The range follows Wyckoff accumulation phases — including a spring or shakeout below support — before the Sign of Strength confirms continuation. This is sometimes called a 'stepping stone' pattern because it represents a rest stop on the way to higher prices.
History & Etymology
Richard D. Wyckoff first described reaccumulation in the 1930s as part of his market cycle theory. He observed that strong uptrends often pause in trading ranges where composite operators (institutions) build additional positions before continuing the markup. The concept remains central to Wyckoff methodology taught by the Wyckoff Stock Market Institute.
The term 'reaccumulation' combines 're-' (again) with 'accumulation' to indicate that institutions are accumulating additional shares or contracts after an initial accumulation phase has already produced a rally.
How It Forms
Formation Steps
- 1Preliminary Supply (PSY): a brief stall or minor pullback after a rally leg
- 2Buying Climax (BC): a sharp upward push marking the top of the range
- 3Automatic Reaction (AR): a selloff from the BC establishing the range bottom
- 4Secondary Test (ST): a retest of the BC area with less momentum
- 5Spring/Shakeout: a brief dip below the range support to shake weak hands
- 6Sign of Strength (SOS): a strong rally on increased volume breaking above the range
- 7Last Point of Support (LPS): a pullback to the top of the range that holds as support
Prerequisites
- Established uptrend prior to the consolidation
- Clear trading range with defined support and resistance
- Volume patterns consistent with Wyckoff accumulation principles
Confirmation Signals
- Sign of Strength rally above the trading range on expanding volume
- Last Point of Support holds with decreasing volume on the pullback
- Price breaks to new highs above the Buying Climax
Invalidation Signals
- Price breaks below the spring low with sustained selling
- Failed Sign of Strength — rally rejected at range resistance
- Increasing supply (volume) on each rally attempt within the range
Candle Breakdown
Range-Establishing Candles
Price oscillates between support and resistance, forming a visible trading range after the prior uptrend leg
Volume tends to dry up as the range develops, indicating that selling pressure is being absorbed rather than increasing.
Spring/Shakeout Candle
A brief dip below the trading range support that quickly reverses, shaking out weak hands
Weak longs sell in panic while institutions absorb their shares. Low volume on the spring confirms lack of genuine selling interest.
Sign of Strength Candle
A strong bullish candle that breaks above the trading range resistance on expanding volume
Demand overwhelms supply as institutions begin the next markup phase. Shorts within the range are forced to cover.
Psychology
Reaccumulation reflects institutional patience. After a profitable markup phase, large players pause to absorb profit-taking supply and build bigger positions before pushing prices higher. The pattern tests the conviction of both bulls and bears.
Buyer Perspective
Institutional buyers use the trading range to accumulate additional inventory at favorable prices. They test the range bottom (spring) to confirm that sellers are exhausted before committing to the next leg up.
Seller Perspective
Profit-takers from the prior rally sell into the range, believing the uptrend is over. Their supply is steadily absorbed by institutional demand, leaving fewer sellers to oppose the eventual breakout.
Smart Money Action
Institutions use limit orders throughout the range to absorb supply. They may engineer the spring to trigger retail stops and acquire shares at discount prices. The SOS is their signal to begin the next markup.
Retail Trader Trap
Retail traders often mistake reaccumulation for distribution and sell or short the range. The spring below support convinces them they are right — only for the SOS breakout to force them to cover.
Emotional Cycle
Trading Strategy
Aggressive Entry
Enter long at the spring low when price quickly reclaims range support with volume drying up on the dip.
Conservative Entry
Wait for the Sign of Strength to break above the range resistance, then enter on the Last Point of Support pullback.
The top of the trading range (if entering at the spring).
A measured move equal to the range height projected above resistance.
The prior markup leg projected from the range breakout (point and figure count).
Best Conditions
- Timeframe: daily
- Timeframe: weekly
- Timeframe: 4h
- established uptrend with a pause
- bull market consolidation
- sector rotation into the asset
- Asset: stocks
- Asset: ETFs
- Asset: crypto
Avoid When
- Timeframe: 1m
- Timeframe: 5m
- bear market rallies
- high correlation with declining indices
- fundamental deterioration
Confluence Factors
- Prior markup leg was strong with expanding volume
- Range forms above a rising 50-day moving average
- Fibonacci retracement of the prior leg aligns with range support
- Sector or index trend supports continuation
- Wyckoff phase analysis confirms accumulation within the range
Scale In Strategy
Enter a starter position at the spring, add on the SOS breakout, and complete the position at the LPS.
Scale Out Strategy
Take one-third profit at the range height projection, one-third at 2x the range, and trail the final third.
Risk Management
Volume Analysis
Volume Confirmation
Volume should decline throughout the range, spike briefly on the spring, then expand on the SOS breakout.
Volume Profile
Decreasing volume on rallies within the range and increasing volume on the SOS confirm institutional accumulation.
Volume Divergence
If volume increases on rallies within the range while price fails to break out, the pattern may be failing.
Technical Confluence
Support Resistance
The trading range creates clearly defined support and resistance. The spring tests support validity; the SOS tests resistance break.
Fibonacci Levels
Range support often aligns with the 38.2% or 50% retracement of the prior markup leg.
Moving Averages
The 20 EMA often flattens within the range and begins rising at the SOS. The 50 SMA often provides support at the range bottom.
Rsi Confirmation
RSI holding above 40 during the range and making higher lows confirms accumulation rather than distribution.
Macd Confirmation
MACD histogram building positive momentum during the SOS confirms buying pressure.
Bollinger Bands
Bollinger Bands narrow during the range (squeeze), then expand on the SOS breakout.
Vwap
Anchored VWAP from the range start should act as support during the LPS.
Ichimoku Cloud
The range ideally forms above the Kumo cloud; a bullish Kumo twist during the range adds confluence.
Elliott Wave
Reaccumulation often corresponds to a Wave 4 consolidation before the final Wave 5 impulse.
Wyckoff Phase
This IS the Wyckoff reaccumulation schematic — all phases (PSY, BC, AR, ST, Spring, SOS, LPS) should be identifiable.
Market Profile
Value area developing within the range with Point of Control rising gradually confirms accumulation.
Order Flow
Cumulative delta trending positive within the range despite sideways price action confirms buying absorption.
Open Interest
Rising open interest during the range in futures confirms new positions are being built.
Multi-Timeframe Analysis
Higher Timeframe Alignment
The weekly chart should confirm a strong uptrend with rising moving averages before looking for reaccumulation on the daily.
Lower Timeframe Entry
Use the 4-hour or 1-hour chart to identify the spring and SOS within the daily range for precise entry timing.
Timeframe Confluence
A weekly uptrend with a daily reaccumulation range and a 4-hour spring entry offers the highest probability setup.
Top-Down Approach
Weekly trend direction, daily range structure, and 4-hour entry signals create a complete multi-timeframe framework.
Statistics
Historical Examples
NVDA Reaccumulation Before AI Rally
successNVIDIA consolidated between $280-$320 for several weeks after its initial AI-driven rally. A brief spring below $280 was followed by a massive SOS breakout that carried the stock above $400.
Lesson: Reaccumulation in a high-conviction trend can produce explosive continuation moves, especially when a fundamental catalyst backs the pattern.
Bitcoin Stepping Stone
successBTC consolidated between $16,000-$19,500 for two weeks, tested the lows once, then broke out with massive volume to new all-time highs above $20,000.
Lesson: Reaccumulation near all-time highs often produces powerful breakouts as sellers are exhausted and new buyers enter on the breakout.
Failed Reaccumulation Turns to Distribution
failureMETA appeared to form a reaccumulation range after a rally, but the spring failed to hold and the SOS was rejected. The pattern turned into distribution, and META declined sharply.
Lesson: Always verify volume patterns within the range. If supply is increasing on rallies, the pattern may be distribution, not reaccumulation.
Variations
Shallow Reaccumulation (High-Level Consolidation)
A very tight consolidation near the highs of the prior move, with minimal pullback and a quick continuation.
Multi-Leg Stepping Stone
Multiple reaccumulation ranges stack on top of each other as the trend progresses, creating a staircase pattern.
Confusion Matrix
Patterns commonly confused with Bullish Reaccumulation and how to distinguish them.
Bullish Accumulation
8500% similarCheck the prior trend: if price was in an uptrend before the range, it is reaccumulation. If it was in a downtrend, it is accumulation.
Key Differences
- Accumulation occurs at a market bottom after a downtrend
- Reaccumulation occurs within an uptrend as a continuation pattern
Bearish Distribution
7500% similarVolume analysis is key: in reaccumulation, volume decreases on drops within the range. In distribution, volume increases on rallies as institutions sell.
Key Differences
- Distribution resolves to the downside; reaccumulation resolves to the upside
- Distribution shows increasing supply on rallies; reaccumulation shows decreasing supply
Bearish redistribution is a Wyckoff concept describing a trading range that forms during a downtrend, where institutional sellers redistribute their remaining positions before the markdown resumes. It mirrors distribution but occurs mid-trend rather than at a top.
Bullish Accumulation is a Wyckoff-based pattern where institutional investors quietly build large positions over an extended period, creating a trading range before a powerful markup phase begins.
The Bullish Flag is the quintessential continuation pattern: a sharp rally (pole) followed by a brief, tight consolidation (flag) before the next leg up. It represents a healthy pause in a strong uptrend.
The Bullish Rectangle Breakout is a continuation pattern where price consolidates between horizontal support and resistance before breaking above the upper boundary to resume the uptrend.
The Bullish Spring is a Wyckoff pattern where price briefly breaks below trading range support to trigger stop losses, then immediately reverses back above support, trapping shorts and initiating a markup phase.
The Distribution phase is a Wyckoff concept where institutional investors systematically sell (distribute) their holdings to the public within a trading range at a market top, before the subsequent markdown (decline) begins.
Pro Tips & Common Mistakes
Pro Tips
- Use Wyckoff's effort vs result principle: if heavy volume (effort) produces little downside progress (result) within the range, accumulation is occurring
- Point and figure counts within the range can project the target for the next markup leg
- The best reaccumulation setups occur after a strong, clean markup leg with institutional sponsorship
- Watch for creek crossings (small resistance breaks within the range) as early signs of demand taking control
- The spring does not always occur — sometimes the LPS forms at a higher low within the range instead
Common Mistakes
- Confusing reaccumulation with distribution — always analyze volume behavior within the range
- Entering too early in the range before the spring or SOS has confirmed the pattern
- Not allowing enough time for the range to develop — Wyckoff patterns require patience
- Ignoring the broader market context — reaccumulation is less likely if the overall market is topping
- Using timeframes that are too small for the pattern's complexity
Advanced Techniques
- Use point and figure charts to count the horizontal range for price target projection
- Compare volume on upswings versus downswings within the range — accumulation shows higher volume on upswings
- Track cumulative delta within the range to identify hidden institutional buying
- Overlay Wyckoff schematics on the range to identify each phase and plan entries accordingly
Institutional Perspective
Institutions actively engineer reaccumulation ranges to absorb supply from profit-takers without driving the price down. They test the range bottom to gauge remaining supply, and once satisfied that sellers are exhausted, they begin the next markup phase. The LPS is where the final institutional buyers who missed the spring enter.
Fun Facts
- Richard Wyckoff himself was said to have made much of his fortune identifying reaccumulation ranges in railroad stocks in the early 1900s.
- The concept of 'stepping stones' in Wyckoff analysis comes from the visual appearance of stacked reaccumulation ranges on a chart, resembling a staircase.
- Some of the most explosive stock moves in history (like AAPL and AMZN during their growth phases) showed clear reaccumulation ranges on weekly charts.
Frequently Asked Questions
Bullish Reaccumulation is a Wyckoff continuation pattern where an uptrend pauses in a trading range as institutions absorb selling pressure and build additional positions before continuing the markup to higher prices.
Analyze volume behavior within the range. In reaccumulation, volume decreases on drops and increases on rallies. In distribution, volume increases on rallies as institutions sell, and price struggles to make new highs within the range.
The best entries are at the spring (shakeout below range support) or at the Last Point of Support after the Sign of Strength has confirmed the breakout above resistance.