Overview
Bearish Redistribution
Also known as: Wyckoff Redistribution, Secondary Distribution, Redistribution Trading Range
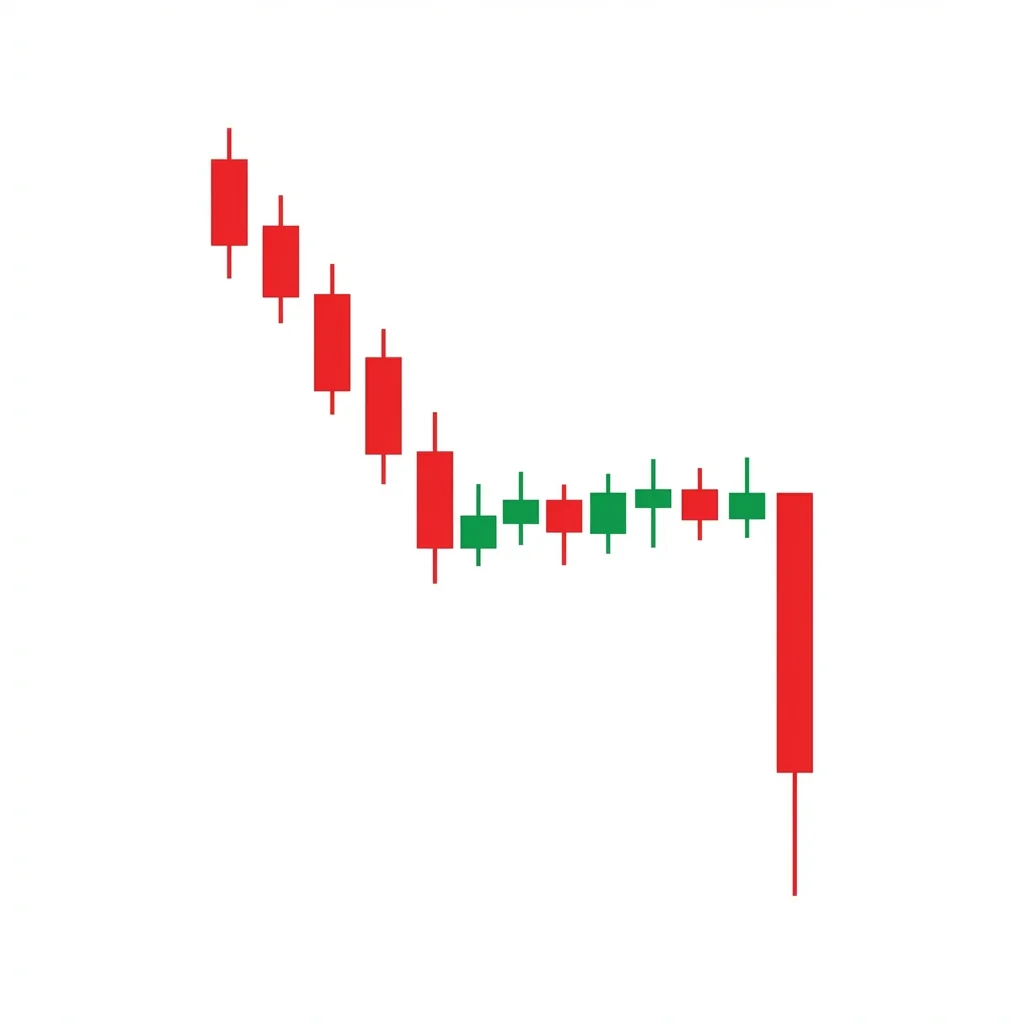
Bearish redistribution is a Wyckoff concept describing a trading range that forms during a downtrend, where institutional sellers redistribute their remaining positions before the markdown resumes. It mirrors distribution but occurs mid-trend rather than at a top.
Redistribution is the Wyckoff equivalent of a bearish continuation pattern. It occurs when a downtrend pauses in a trading range as institutional traders who missed the initial decline, or those adding to existing shorts, redistribute shares to willing buyers. The range features several identifiable phases: a selling climax that marks the low, an automatic rally that marks the high, secondary tests, potential upthrusts (false breakouts), and eventually a sign of weakness (SOW) followed by the last point of supply (LPSY) before the markdown resumes. The key difference from accumulation is that volume patterns favor selling—rallies occur on declining volume while declines show expanding volume. Understanding redistribution helps traders stay on the right side of the larger trend and avoid buying false bottoms.
History & Etymology
Redistribution was described by Richard D. Wyckoff in the 1930s as part of his market cycle theory. Wyckoff observed that large operators (composite man) would use consolidation phases within downtrends to offload additional positions before driving prices lower. The concept was later refined by the Wyckoff Stock Market Institute.
'Re-distribution' means distributing again—institutional sellers are distributing shares for a second time (or more) within an ongoing downtrend. The prefix 're-' distinguishes it from the initial distribution that occurs at market tops.
How It Forms
Formation Steps
- 1Preliminary Support (PSY) — initial selling slows the markdown
- 2Selling Climax (SC) — heavy selling marks the low of the range
- 3Automatic Rally (AR) — short-covering bounce sets the upper boundary
- 4Secondary Test (ST) — price retests the SC area with less volume
- 5Upthrust After Distribution (UTAD) — false breakout above the range
- 6Sign of Weakness (SOW) — strong decline through support
- 7Last Point of Supply (LPSY) — weak rally before final breakdown
Prerequisites
- Established downtrend preceding the trading range
- Volume expansion during the initial selling climax
- The range forms a consolidation within a larger bearish trend
Confirmation Signals
- Sign of Weakness: price drops below the trading range support on heavy volume
- Last Point of Supply: weak rally fails well below resistance
- Breakdown below the range on expanding volume
Invalidation Signals
- Price breaks above the range with sustained volume and momentum
- Upthrust leads to genuine trend reversal rather than failure
- Volume patterns suggest accumulation rather than redistribution
Candle Breakdown
Selling Climax (SC)
A large bearish candle with heavy volume that marks the low of the redistribution range.
Panic selling exhausts itself temporarily, creating the lower boundary of the trading range.
Automatic Rally (AR)
A bounce driven by short-covering and bargain hunting that establishes the upper boundary of the range.
Short-term relief as shorts cover and bargain hunters buy. However, this rally is on declining volume, showing weak demand.
Sign of Weakness (SOW)
A strong decline on heavy volume that breaks below the trading range support, signaling that the markdown is about to resume.
Institutional selling overwhelms the remaining buyers, breaking through the support that held during the consolidation.
Psychology
Redistribution exploits the hope of bottom-fishers who believe the downtrend has ended. Institutions use this optimism to offload positions before driving price lower again.
Buyer Perspective
Buyers believe the consolidation is a bottoming pattern and accumulate shares. Each rally reinforces their belief until the SOW shatters their thesis.
Seller Perspective
Institutional sellers use each rally within the range as an opportunity to sell more. They are patient, distributing gradually to avoid moving the market until the final markdown.
Smart Money Action
The composite man uses the trading range to sell remaining positions to hopeful buyers. False rallies and upthrusts are engineered to attract maximum buying before the final markdown.
Retail Trader Trap
Retail traders interpret the trading range as a bottom and buy the 'support' level. The upthrust (false breakout above the range) traps the final wave of buyers.
Emotional Cycle
Trading Strategy
Aggressive Entry
Enter short on the upthrust (UTAD) failure when price breaks above the range and immediately reverses back inside.
Conservative Entry
Wait for the Sign of Weakness (breakdown below support) followed by a rally to the Last Point of Supply (LPSY), then enter short.
Height of the redistribution range projected downward
Next significant support zone below
A measured move equal to the prior markdown leg
Best Conditions
- Timeframe: 1D
- Timeframe: 1W
- Timeframe: 4h
- Bear markets
- Sector-wide downtrends
- Post-earnings sell-offs
- Asset: Stocks
- Asset: Indices
- Asset: Crypto
Avoid When
- Timeframe: 1m
- Timeframe: 5m
- Timeframe: 15m
- Bull markets
- V-shape recovery environments
Confluence Factors
- Prior markdown confirms the bearish context
- Volume analysis supports redistribution (rallies on low volume)
- Moving averages sloping downward above the range
- Sector weakness confirming the individual stock's decline
- Relative strength underperformance vs. the index
Scale In Strategy
Enter initial position at the UTAD failure, add at the SOW, and add a final tranche at the LPSY.
Scale Out Strategy
Take profits at the measured move target and trail the remainder with a 50 SMA.
Risk Management
Volume Analysis
Volume Confirmation
Rallies within the range should show declining volume (weak demand). The SOW decline should show expanding volume (strong supply).
Volume Profile
Volume concentrated at the top of the range indicates selling pressure. Low volume at the bottom suggests lack of buying interest.
Volume Divergence
If rallies show increasing volume, the pattern may be accumulation rather than redistribution—exercise extreme caution.
Technical Confluence
Support Resistance
The redistribution range defines clear support and resistance. The SOW break through support is the critical signal.
Fibonacci Levels
The AR typically retraces 38.2-50% of the prior markdown. The SOW breakdown often targets the 127.2% extension.
Moving Averages
The 50 and 200 SMAs often roll over and cross (death cross) during or shortly after redistribution completes.
Rsi Confirmation
RSI failing to break above 60 during rallies within the range confirms weak momentum.
Macd Confirmation
MACD remaining below zero throughout the consolidation confirms the bearish bias.
Bollinger Bands
Bands contracting during the range and expanding on the SOW breakdown signal the start of a new trending phase.
Vwap
Price consistently trading below VWAP during the range confirms selling pressure.
Ichimoku Cloud
The range forming below the Kumo cloud confirms the bearish context.
Elliott Wave
Redistribution often corresponds to Wave 2 or Wave 4 corrections in a larger bearish impulse.
Wyckoff Phase
This IS the Wyckoff redistribution phase—it is the defining example.
Market Profile
The redistribution range defines a value area. The SOW is a breakout below value, signaling a new lower value area developing.
Order Flow
Cumulative delta trending negative throughout the range confirms that sellers dominate despite the sideways price action.
Open Interest
Monitor open interest changes for additional confirmation of institutional participation in the move.
Multi-Timeframe Analysis
Higher Timeframe Alignment
A daily redistribution range should align with a weekly downtrend and a monthly resistance level.
Lower Timeframe Entry
Use the 4H or 1H chart to identify the LPSY and SOW phases with more precision for entry timing.
Timeframe Confluence
A 4H redistribution range within a daily downtrend, confirmed by weekly bearish structure, is the ideal setup.
Top-Down Approach
Weekly downtrend confirmed > Daily redistribution range identified > 4H entry at LPSY or SOW.
Statistics
Historical Examples
Netflix Redistribution 2022
successNetflix formed a redistribution range between $350-$400 after its initial markdown from $700. The SOW breakdown led to a further drop to $165.
Lesson: Redistribution ranges in high-profile stocks during bear markets can lead to massive continuation moves.
Ethereum Redistribution in 2022 Bear Market
successETH consolidated between $1,700-$2,200 after its initial drop from $3,500. The redistribution completed with a SOW that led to ETH falling to $880.
Lesson: Crypto redistribution ranges can be particularly volatile, with upthrusts that test patience before the markdown resumes.
Variations
Short Redistribution
A compressed redistribution range that completes in 2-4 weeks, often seen in fast-moving bear markets.
Redistribution with Spring
A redistribution range that includes a brief drop below support (spring) before the upthrust and eventual breakdown.
Confusion Matrix
Patterns commonly confused with Bearish Redistribution and how to distinguish them.
Bearish Distribution
8000% similarCheck the trend before the trading range. If it was an uptrend, it is distribution. If it was a downtrend (markdown), it is redistribution.
Key Differences
- Distribution occurs at market tops; redistribution occurs mid-downtrend
- Distribution follows an uptrend; redistribution follows a markdown
- Distribution is the initial selling; redistribution is secondary selling
Bullish Accumulation
7000% similarVolume analysis is the key differentiator. Study whether rallies or declines have stronger volume—this reveals whether the range is accumulation or redistribution.
Key Differences
- Accumulation has rallies on increasing volume and declines on decreasing volume
- Redistribution has rallies on decreasing volume and declines on increasing volume
- The prior trend context is different
The Distribution phase is a Wyckoff concept where institutional investors systematically sell (distribute) their holdings to the public within a trading range at a market top, before the subsequent markdown (decline) begins.
The Downtrend is the most fundamental bearish pattern — a persistent series of lower highs and lower lows demonstrating that sellers consistently overwhelm buyers at progressively lower price levels.
The bearish flag is a continuation pattern consisting of a sharp decline (flagpole) followed by a gentle upward-sloping consolidation (flag) before price breaks down to continue the trend.
A bearish rectangle breakdown occurs when price trades in a horizontal range between parallel support and resistance before breaking below support. The measured move target equals the height of the rectangle projected downward from the breakdown point.
Bullish Reaccumulation is a Wyckoff continuation pattern where institutions pause an uptrend to absorb supply and build additional positions within a trading range before continuing the markup phase.
The bearish upthrust is a Wyckoff concept where price briefly breaks above a trading range's resistance before reversing sharply back inside. This false breakout traps breakout buyers and signals that institutional sellers are using the higher prices to distribute, leading to a subsequent decline.
Pro Tips & Common Mistakes
Pro Tips
- Volume analysis is the single most important tool for identifying redistribution. Rallies on declining volume are the signature.
- The upthrust (UTAD) is the best entry point but also the hardest to identify in real-time.
- Be patient—redistribution ranges can last weeks or months. Do not force an entry before the SOW confirms.
- The LPSY is the highest probability entry because the SOW has already confirmed the bearish intent.
- Compare the redistribution range to the prior markdown to estimate the continuation target.
Common Mistakes
- Confusing redistribution with accumulation—always analyze volume on rallies vs. declines
- Buying the 'support' of the range, not recognizing it as redistribution
- Entering too early before the SOW confirms the breakdown direction
- Ignoring the upthrust as a warning signal—it often traps the last buyers
- Not accounting for the full duration of redistribution (it can take months)
Advanced Techniques
- Use point-and-figure charts to count the horizontal cause within the redistribution range and project the price target for the coming markdown.
- Apply the Wyckoff absorption/effort vs. result analysis to each rally and decline within the range.
- Track relative strength of the stock vs. its index—persistent underperformance during the range confirms redistribution.
- Use the volume-at-price histogram to identify whether volume is concentrated at the top of the range (redistribution) or bottom (accumulation).
Institutional Perspective
Institutions use redistribution ranges to sell remaining positions or establish new short positions. The trading range provides enough liquidity through retail buying to absorb their sell orders without crashing the price prematurely.
Fun Facts
- Richard Wyckoff developed his market methodology in the early 1900s, and redistribution remains one of the most respected concepts in institutional trading education.
- The Wyckoff Stock Market Institute in Arizona still teaches redistribution analysis as a core component of their curriculum.
- Some algorithmic trading firms have built systematic models based on Wyckoff redistribution patterns, demonstrating the concept's enduring relevance.
Frequently Asked Questions
Redistribution is a trading range that forms during a downtrend where institutional sellers distribute remaining positions to buyers before the markdown resumes. It is the bearish continuation equivalent of reaccumulation.
The key difference is volume analysis. In redistribution, rallies occur on decreasing volume (weak demand) and declines occur on increasing volume (strong supply). In accumulation, the opposite is true.
The Last Point of Supply (LPSY) offers the best risk-reward entry. It occurs after the Sign of Weakness (SOW) has confirmed the bearish direction, providing a low-risk entry on a weak rally before the final breakdown.