Overview
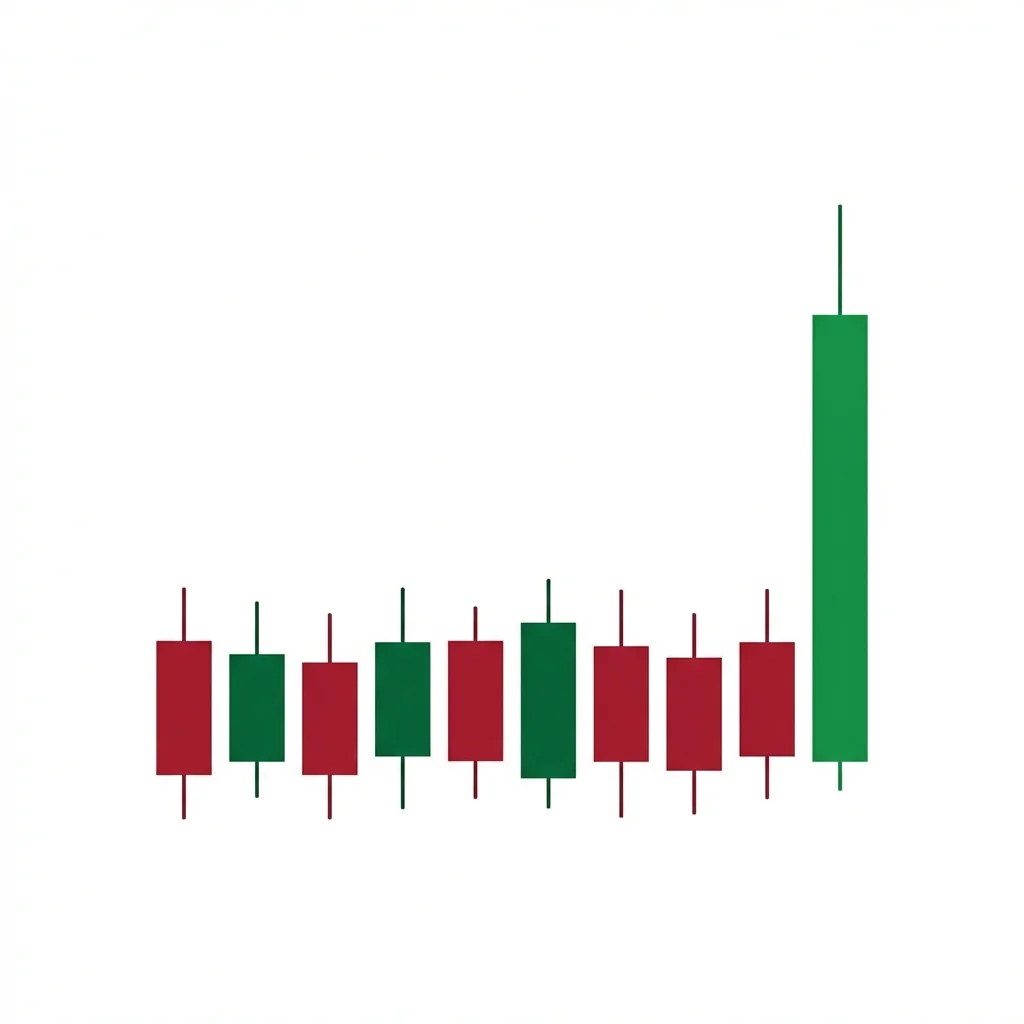
Bullish Rectangle Breakout
Also known as: Bullish Box Breakout, Horizontal Channel Breakout, Range Breakout
The Bullish Rectangle Breakout is a continuation pattern where price consolidates between horizontal support and resistance before breaking above the upper boundary to resume the uptrend.
A rectangle forms when buyers and sellers reach equilibrium within a horizontal channel. Each bounce off support represents buying, and each rejection at resistance represents selling. Over time, supply from sellers is absorbed by persistent demand. When price finally breaks above resistance on volume, the equilibrium shifts decisively in favor of buyers. The measured move target equals the height of the rectangle projected upward from the breakout point.
History & Etymology
Rectangle patterns have been recognized in Western technical analysis since the early days of charting in the late 19th century. Edwards and Magee formalized the pattern in their 1948 classic 'Technical Analysis of Stock Trends', describing it as one of the most reliable continuation formations.
Named for the rectangular shape formed by the horizontal support and resistance boundaries that confine price action. Also called a 'box' or 'horizontal channel' in common trading parlance.
How It Forms
Formation Steps
- 1Price consolidates between clearly defined horizontal support and resistance levels
- 2At least two touches on both the upper and lower boundaries of the range
- 3A decisive breakout candle closes above the rectangle resistance on increased volume
Prerequisites
- Prior uptrend establishes the bullish context
- Horizontal support and resistance boundaries are clearly identifiable
- At least two tests of each boundary
Confirmation Signals
- Strong close above resistance with volume at least 50% above average
- Follow-through buying on the next candle after the breakout
- Successful retest of resistance as support
Invalidation Signals
- Breakout candle closes back within the range (false breakout)
- Volume is light on the breakout
- Price breaks below the rectangle support
Candle Breakdown
Range Candles
Multiple candles bounce between support and resistance, establishing the rectangular consolidation zone
Volume typically declines as the range develops, signaling that sellers are gradually being absorbed and equilibrium is approaching a resolution.
Breakout Candle
A strong bullish candle that closes decisively above the rectangle resistance with expanding volume
Buyers overwhelm remaining supply at resistance. Volume surge confirms institutional participation in the breakout.
Psychology
The rectangle represents a battle between buyers and sellers at clearly defined levels. Sellers defend resistance while buyers defend support. The breakout occurs when supply at resistance is fully absorbed and buyers push through.
Buyer Perspective
Buyers accumulate on each touch of support, gradually absorbing available supply. When resistance finally breaks, it confirms their thesis and triggers additional buying.
Seller Perspective
Sellers defend resistance and take profits at the top of the range. When resistance breaks, sellers must cover shorts or accept the loss, fueling the breakout.
Smart Money Action
Institutions buy at support and gradually shift their limit orders higher as they absorb supply. The final breakout often coincides with their orders moving above resistance.
Retail Trader Trap
Retail traders often fade breakouts (selling the break above resistance), expecting it to fail. They get trapped when the breakout holds and price accelerates higher.
Emotional Cycle
Trading Strategy
Aggressive Entry
Enter long as soon as a candle closes above the rectangle resistance with above-average volume.
Conservative Entry
Wait for a breakout above resistance followed by a pullback that retests the broken resistance as support.
Rectangle height projected above the breakout point.
1.5x the rectangle height above the breakout point.
2x the rectangle height or the next major resistance level.
Best Conditions
- Timeframe: daily
- Timeframe: 4h
- Timeframe: 1h
- trending market with a pause
- low volatility environment compressing into a range
- bull market consolidation
- Asset: stocks
- Asset: forex
- Asset: ETFs
- Asset: crypto
Avoid When
- Timeframe: 1m
- Timeframe: 5m
- choppy, directionless markets
- extreme volatility
- bear market rallies
Confluence Factors
- Prior uptrend supports continuation bias
- Rectangle forms above a rising moving average
- Volume decreases within the range (squeeze)
- RSI holds above 50 throughout the range
- Sector or market trend supports the breakout direction
Scale In Strategy
Enter half on the breakout and add on a successful retest of resistance as support.
Scale Out Strategy
Take one-third at the measured move target, one-third at 1.5x, and trail the rest.
Risk Management
Volume Analysis
Volume Confirmation
Volume should expand on the breakout candle to at least 50% above the average range volume.
Volume Profile
Declining volume within the range followed by a volume spike on the breakout is the ideal profile.
Volume Divergence
If volume is high but price fails to hold above resistance, the breakout may be false.
Technical Confluence
Support Resistance
The rectangle itself defines the key support and resistance. After breakout, former resistance becomes support.
Fibonacci Levels
The 50% retracement of the prior uptrend leg often aligns with the rectangle support.
Moving Averages
A rising 50-day moving average at or below rectangle support adds strong confluence for the breakout.
Rsi Confirmation
RSI holding above 50 and trending upward within the range supports bullish continuation.
Macd Confirmation
MACD crossing above the signal line during or just before the breakout confirms momentum.
Bollinger Bands
Bollinger Band squeeze within the rectangle followed by expansion on the breakout is a strong signal.
Vwap
Anchored VWAP from the start of the rectangle should act as support after the breakout.
Ichimoku Cloud
Rectangle forming above the Kumo cloud with bullish alignment strengthens the breakout signal.
Elliott Wave
The rectangle often corresponds to a Wave 4 consolidation before a Wave 5 impulse.
Wyckoff Phase
The rectangle can be viewed as a simplified reaccumulation trading range in Wyckoff terms.
Market Profile
Value area developing within the rectangle with a breakout above the value area high confirms the move.
Order Flow
Increasing cumulative delta within the range despite sideways price action confirms hidden buying.
Open Interest
Rising open interest within the range confirms new positions are being built for the breakout.
Multi-Timeframe Analysis
Higher Timeframe Alignment
Confirm the weekly trend is bullish before trading a daily rectangle breakout. A weekly close above resistance is the strongest confirmation.
Lower Timeframe Entry
Use the 1-hour chart to find a precise breakout entry within the daily rectangle, such as a mini-flag or consolidation at resistance.
Timeframe Confluence
A daily rectangle forming within a weekly uptrend, with a 4-hour volume spike on the breakout, is a high-probability setup.
Top-Down Approach
Weekly trend direction, daily rectangle identification, and 4-hour breakout timing for optimal entry.
Statistics
Historical Examples
AAPL Rectangle Continuation
successAAPL consolidated between $142-$150 for three weeks after a strong rally. The stock broke out above $150 on heavy volume and rallied to $157, exceeding the measured move target.
Lesson: Rectangles in strong uptrends with clear volume confirmation tend to produce reliable measured moves.
EUR/USD Box Breakout
partialEUR/USD consolidated between 0.9860-0.9960 for five days. The breakout above 0.9960 produced a move to 1.0010, slightly short of the full measured move target.
Lesson: Forex rectangles may not always achieve the full measured move due to competing flows; consider taking partial profits early.
Failed SPY Rectangle
failureSPY broke above a rectangle high of $430 but immediately reversed the next day, closing back within the range. The false breakout led to a decline to $390.
Lesson: Always confirm the breakout with volume and follow-through. A single candle above resistance without conviction is not enough.
Variations
Narrow Rectangle (Tight Box)
A very tight rectangle with a narrow range, indicating strong compression before breakout.
Wide Rectangle
A rectangle with a larger price range, providing more trading room but less energy on breakout.
Confusion Matrix
Patterns commonly confused with Bullish Rectangle Breakout and how to distinguish them.
Bullish Ascending Triangle
7000% similarCheck if the lows are rising (ascending triangle) or flat (rectangle). Flat support and resistance = rectangle.
Key Differences
- Ascending triangle has rising support (higher lows) while the rectangle has flat support
- The ascending triangle shows increasing buying pressure; the rectangle shows equilibrium
Bullish Flag
6500% similarMeasure the slope of support and resistance. If both are horizontal, it is a rectangle. If they slope slightly downward, it is a flag.
Key Differences
- A flag has a slight downward slope to its boundaries
- A rectangle has perfectly horizontal boundaries
A bearish rectangle breakdown occurs when price trades in a horizontal range between parallel support and resistance before breaking below support. The measured move target equals the height of the rectangle projected downward from the breakdown point.
The Bullish Ascending Channel is a continuation pattern where price trends upward within two parallel trendlines, providing clear buy zones at the lower boundary and profit targets at the upper boundary.
The Bullish Ascending Triangle is a continuation pattern featuring flat resistance and rising support. Buyers are consistently willing to pay higher prices, compressing the range until a breakout above resistance triggers the next leg up.
The Bullish Flag is the quintessential continuation pattern: a sharp rally (pole) followed by a brief, tight consolidation (flag) before the next leg up. It represents a healthy pause in a strong uptrend.
The Bullish Pennant is a continuation pattern featuring a sharp advance (flagpole) followed by a brief triangular consolidation (pennant), before price breaks out and continues higher with a measured move equal to the flagpole.
Bullish Reaccumulation is a Wyckoff continuation pattern where institutions pause an uptrend to absorb supply and build additional positions within a trading range before continuing the markup phase.
Pro Tips & Common Mistakes
Pro Tips
- The longer the rectangle persists, the more powerful the eventual breakout tends to be — accumulated energy equals the stored supply and demand
- Use volume profile to identify if more volume occurs at the top or bottom of the range — higher volume near the top suggests absorption of supply
- False breakouts above the range that quickly reverse are warning signs — wait for a solid close and follow-through
- The measured move target (range height projected from the breakout) is achieved roughly 60% of the time
- Rectangles that form above a rising 50-day moving average have significantly higher breakout success rates
Common Mistakes
- Trading the breakout without volume confirmation — low-volume breakouts fail frequently
- Setting stops too tight (just below resistance) — use the range midpoint or support for your stop
- Ignoring the prior trend — a rectangle after a downtrend may break down, not up
- Over-trading within the range instead of waiting for the breakout
- Not waiting for a retest when the breakout is marginal — patience often provides a better entry
Advanced Techniques
- Use Bollinger Band width as a timing tool — the tightest squeeze within the rectangle often precedes the breakout
- Combine with relative strength analysis — a stock consolidating in a rectangle while its sector rallies often produces a powerful catch-up breakout
- Apply anchored VWAP from the start of the range to define institutional cost basis and potential support after breakout
- Monitor dark pool activity during the range for signs of institutional accumulation
Institutional Perspective
Institutions prefer rectangle consolidations because they can fill large orders at consistent prices within the range. The breakout often occurs when their accumulation is complete and they allow the natural order flow to push price through resistance.
Fun Facts
- Edwards and Magee considered the rectangle one of the most 'honest' chart patterns because its boundaries are clearly defined and the measured move target is straightforward to calculate.
- Studies show that roughly 70% of rectangle patterns in uptrends break to the upside, confirming the continuation bias.
- The rectangle is one of the few patterns that works well across all asset classes — stocks, forex, crypto, and commodities.
Frequently Asked Questions
A Bullish Rectangle Breakout is a continuation pattern where price consolidates between horizontal support and resistance, then breaks above resistance to resume an uptrend. The measured move target equals the height of the rectangle.
Look for a strong close above resistance with volume at least 50% above the average during the range. Follow-through buying the next day and a successful retest of resistance as support add further confirmation.
A rectangle should have at least two touches on both support and resistance, which typically requires 8-20 candles minimum. Longer rectangles tend to produce more powerful breakouts.