Overview
Bullish Power of Three
Also known as: AMD Bullish Setup, Accumulation-Manipulation-Distribution
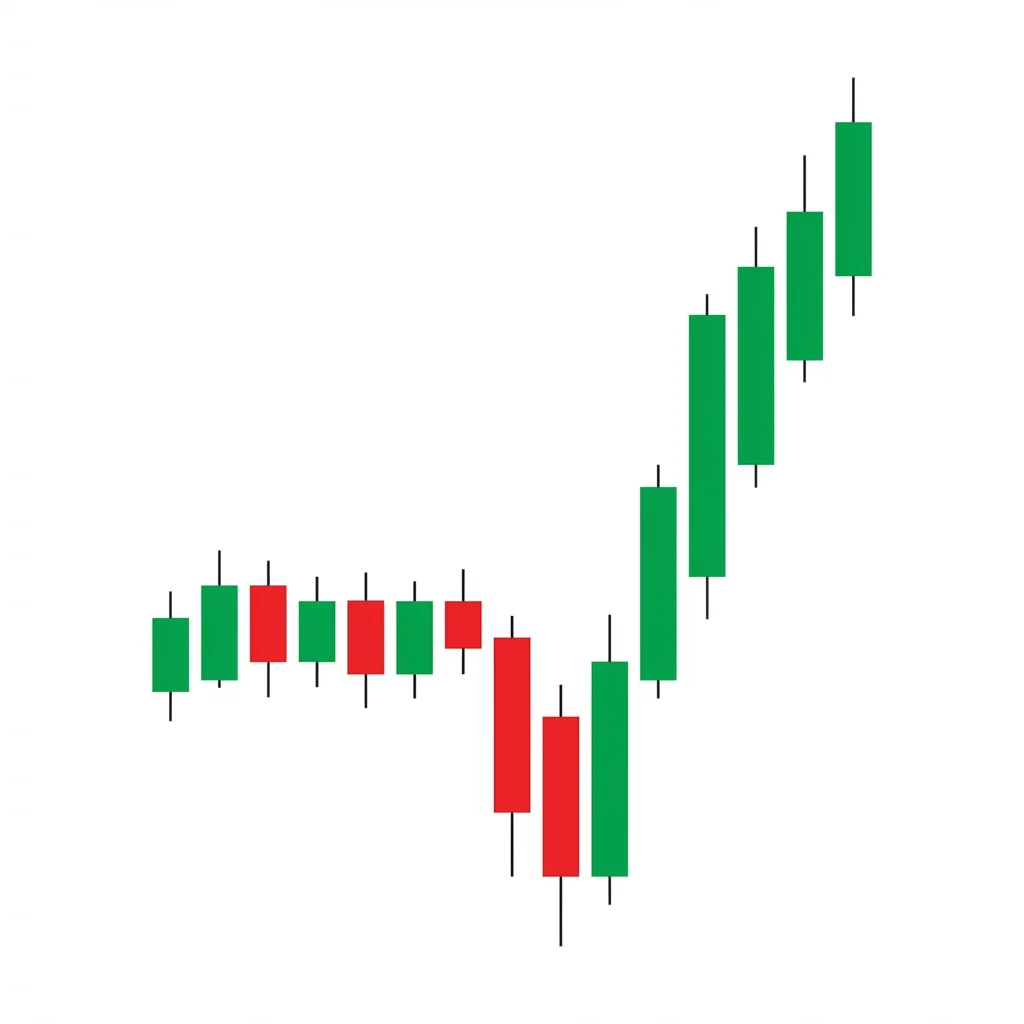
The Bullish Power of Three (AMD) is an ICT concept describing a three-phase market cycle: accumulation in a range, manipulation below the range to grab liquidity, followed by distribution as price rallies aggressively higher.
The Power of Three is a smart money concept popularized by ICT (Inner Circle Trader) that describes how institutional algorithms engineer liquidity. During accumulation, large players quietly build positions within a tight range. The manipulation phase sweeps below the range to trigger retail stop losses and induce short entries, providing institutions with additional buy-side liquidity. Finally, the distribution phase drives price sharply higher as institutions mark up their positions. This pattern frequently occurs on daily candles (open-to-low-to-high) and intraday around session opens.
History & Etymology
The Power of Three concept was developed and popularized by Michael J. Huddleston (ICT) as part of his Inner Circle Trader methodology. It draws on Wyckoff theory and market maker models, reframed through the lens of algorithmic market-making and institutional order flow in modern electronic markets.
Named 'Power of Three' for its three distinct phases: Accumulation, Manipulation, and Distribution (AMD). The concept reflects the idea that markets move in three acts orchestrated by institutional participants.
How It Forms
Formation Steps
- 1Accumulation phase: price consolidates in a tight range during the Asian session or early trading hours
- 2Manipulation phase: price sweeps below the consolidation low, triggering stop losses and trapping sellers
- 3Distribution phase: price reverses sharply upward, breaking above the accumulation range and trending higher
Prerequisites
- Higher timeframe bullish bias or key support level
- Clear consolidation range (accumulation)
- Liquidity pool below the range low
Confirmation Signals
- Strong rejection wick below the accumulation range
- Rapid reclaim of the consolidation low
- Bullish displacement candle breaking above the range high
Invalidation Signals
- Price fails to reclaim the accumulation range after the sweep
- Sustained trading below the manipulation low
- No displacement or momentum on the upside move
Candle Breakdown
Accumulation Candle(s)
Tight-range candles forming a consolidation zone where institutions build positions quietly
The market appears calm and directionless. Retail traders lose interest or prepare for a breakout in either direction.
Manipulation Candle
Price sweeps below the accumulation range, creating a false breakdown that traps sellers
Retail traders panic sell as stops are triggered. Smart money absorbs this selling as cheap entry. Fear peaks at the manipulation low.
Distribution Candle
A strong bullish displacement candle that breaks above the accumulation range high, signaling the markup phase
Trapped shorts scramble to cover while sidelined bulls chase. Smart money is already positioned and distributes into the rally.
Psychology
The Power of Three exploits the predictable behavior of retail traders who place stops below consolidation ranges. Institutions engineer a false breakdown to fill their buy orders against retail selling before driving price to their actual target higher.
Buyer Perspective
Smart money buyers accumulate during the range, add aggressively during the manipulation sweep, and begin distributing into strength during the rally phase.
Seller Perspective
Retail sellers are induced into short positions during the manipulation phase, believing a downside breakout is occurring. They are forced to cover at a loss during distribution.
Smart Money Action
Institutions use the accumulation phase to build positions at favorable prices, the manipulation phase to trigger retail stops for additional liquidity, and the distribution phase to mark up price toward their sell-side targets.
Retail Trader Trap
Retail traders short the breakdown below the range, placing stops above the range high. The distribution phase runs through these stops, creating a cascade of forced buying that fuels the rally.
Emotional Cycle
Trading Strategy
Aggressive Entry
Enter long immediately upon seeing the manipulation wick reclaim the accumulation range low with a bullish candle close.
Conservative Entry
Wait for price to break above the accumulation range high with a displacement candle before entering long.
The accumulation range high (if entering on the sweep).
The next higher-timeframe liquidity pool or previous swing high.
2x to 3x the accumulation range projected above the range high.
Best Conditions
- Timeframe: daily
- Timeframe: 1h
- Timeframe: 15m
- trending market with pullbacks
- session opens (London, New York)
- around high-impact news events
- Asset: forex
- Asset: indices
- Asset: crypto
Avoid When
- Timeframe: 1m
- Timeframe: weekly
- low-volatility holiday markets
- extremely choppy ranges
- no clear higher-timeframe bias
Confluence Factors
- Higher-timeframe bullish order block at the manipulation level
- Fair value gap above the accumulation range
- Fibonacci 61.8-79% retracement alignment
- Session open price alignment
- Previous day high/low as a target
Scale In Strategy
Enter a partial position on the manipulation sweep, add on the reclaim of the range, and add again on the break above the range high.
Scale Out Strategy
Take one-third at the range high, one-third at the next liquidity pool, and trail the final third.
Risk Management
Volume Analysis
Volume Confirmation
Volume should spike during the manipulation sweep and remain elevated during the displacement candle.
Volume Profile
High volume at the manipulation low followed by aggressive buying volume on the distribution move.
Volume Divergence
Declining volume during accumulation with a volume surge on the sweep and reversal confirms the pattern.
Technical Confluence
Support Resistance
The manipulation phase targets buy-side liquidity below support. The distribution phase targets sell-side liquidity above resistance.
Fibonacci Levels
The manipulation sweep often reaches the 61.8% to 79% retracement of the prior bullish leg, creating an optimal trade entry (OTE).
Moving Averages
The accumulation range often forms around key moving averages (20 EMA, 50 SMA) that act as mean reversion anchors.
Rsi Confirmation
RSI divergence between the manipulation low and the prior swing low adds confidence to the reversal.
Macd Confirmation
MACD histogram turning positive during the distribution phase confirms momentum shift.
Bollinger Bands
The manipulation sweep often touches or pierces the lower Bollinger Band before the reversal.
Vwap
Intraday AMD patterns often see the manipulation sweep below VWAP followed by a reclaim and distribution above VWAP.
Ichimoku Cloud
Best results when the pattern forms above or at the Kumo cloud with bullish Tenkan-Kijun alignment.
Elliott Wave
The manipulation phase often corresponds to a Wave 2 or Wave 4 corrective low.
Wyckoff Phase
The AMD pattern closely mirrors Wyckoff accumulation with the spring (manipulation) followed by markup (distribution).
Market Profile
Look for the manipulation sweep to reach the Value Area Low or Point of Control for confluence.
Order Flow
Delta divergence during the manipulation phase (price making new lows but delta turning positive) confirms institutional buying.
Open Interest
In futures, rising open interest during the distribution phase confirms new long positions are being established.
Multi-Timeframe Analysis
Higher Timeframe Alignment
Identify the bullish bias on the daily or weekly chart before looking for AMD setups on lower timeframes.
Lower Timeframe Entry
Use the 5-minute or 15-minute chart to pinpoint the manipulation sweep low for a precise entry.
Timeframe Confluence
A daily bullish order block aligning with a 1-hour AMD manipulation sweep offers the highest probability setup.
Top-Down Approach
Weekly bias determines direction, daily chart identifies the AMD range, and the 15-minute chart times the manipulation entry.
Statistics
Historical Examples
EUR/USD London Open AMD
successEUR/USD accumulated during the Asian session between 1.0720-1.0735. At London open, price swept below to 1.0710 (manipulation) before rallying to 1.0780 (distribution).
Lesson: Session-based AMD patterns on forex pairs offer some of the cleanest Power of Three setups.
S&P 500 Daily AMD
successThe S&P 500 consolidated for three days, swept the range low on a bearish open, then reversed to close near the highs — a textbook daily Power of Three candle.
Lesson: Daily candles that open near the low, sweep lower, then close near the high often represent a completed AMD cycle within a single bar.
BTC Failed AMD
failureBitcoin accumulated around $25,800, swept below to $25,600, but failed to reclaim the range. Price continued lower to $25,200.
Lesson: When the manipulation sweep fails to produce immediate displacement back above the range, the pattern is invalidated. Do not force the trade.
Variations
Intraday AMD (Session-Based)
The pattern unfolds within a single trading session, with accumulation in the Asian session, manipulation at London open, and distribution through New York.
Daily Candle AMD
A single daily candle embodies the AMD cycle: opening mid-range, sweeping the low, and closing near the high.
Confusion Matrix
Patterns commonly confused with Bullish Power of Three and how to distinguish them.
Bullish Spring
8500% similarThe Power of Three explicitly includes the distribution phase and is framed around session-based or daily candle structure, while the spring is a single event within Wyckoff accumulation.
Key Differences
- Spring is a Wyckoff concept focusing on the test below support in an accumulation range
- Power of Three emphasizes the three-phase AMD cycle including distribution targets
Bullish Bear Trap
7000% similarThe Power of Three requires a clear accumulation phase before the manipulation, whereas a bear trap can occur without prior consolidation.
Key Differences
- Bear trap is a general false breakdown concept
- Power of Three has a structured three-phase framework with specific entry models
The bearish power of three (PO3) is a smart money concept describing a three-phase intraday process: accumulation (consolidation), manipulation (false breakout above the range), and distribution (sharp reversal downward). It represents how institutions engineer liquidity to fill sell orders.
A Bear Trap occurs when price breaks below a key support level, luring bears into short positions, only to reverse sharply higher. The trapped shorts are forced to cover, adding fuel to the bullish reversal.
The Bullish Fair Value Gap (FVG) is a smart money concept identifying price imbalances where aggressive buying creates a gap between the first candle high and third candle low. Price often returns to this zone to fill the inefficiency before continuing higher.
A Bullish Order Block is the last bearish candle before a strong upside displacement. It marks where institutional buying occurred, and when price returns to this zone, it often bounces as institutions defend their entry level.
The Bullish Selling Climax occurs when an extended downtrend reaches a point of maximum panic, producing a wide-range bearish candle on extraordinary volume. The exhaustion of selling pressure creates conditions for a sharp reversal as the last sellers capitulate.
The Bullish Spring is a Wyckoff pattern where price briefly breaks below trading range support to trigger stop losses, then immediately reverses back above support, trapping shorts and initiating a markup phase.
Pro Tips & Common Mistakes
Pro Tips
- The daily candle's open-to-low-to-high structure often reveals a completed AMD cycle — study daily candle wicks to identify these
- Session opens (London and New York) are the most common times for the manipulation phase to begin
- Use the manipulation low as your stop loss for optimal risk-to-reward ratios
- The manipulation sweep should be quick and aggressive — a slow grind below the range is not a true AMD pattern
- Look for fair value gaps created during the distribution phase as future support if price retests
Common Mistakes
- Shorting the manipulation sweep instead of recognizing it as a liquidity grab
- Entering too early during the accumulation phase before the manipulation has occurred
- Not having a higher-timeframe directional bias — AMD works best with a clear institutional narrative
- Confusing a genuine breakdown with a manipulation sweep — always wait for the reclaim
- Setting take profit too close and missing the full distribution move
Advanced Techniques
- Combine AMD with ICT order blocks — enter at the order block formed during the manipulation phase
- Use the manipulation sweep low as a breaker block for future long entries if price retests
- Study the time element — manipulation often occurs within the first 30-60 minutes of a session open
- Overlay open interest data (futures) to confirm institutional positioning during the accumulation phase
Institutional Perspective
The Power of Three is fundamentally an institutional model. Large players need liquidity to fill their orders, and the manipulation phase provides that liquidity by triggering retail stops. Institutions view the accumulation-manipulation-distribution cycle as a natural consequence of needing to move large positions without excessive slippage.
Fun Facts
- The Power of Three concept suggests that roughly 70% of daily candles in trending markets exhibit the AMD structure in their open-low-high-close sequence.
- ICT traders often refer to the manipulation phase as 'Judas Swing' because it deceives retail traders into the wrong direction.
- The concept was originally described in the context of forex markets but has been successfully applied to crypto, indices, and even commodities.
Frequently Asked Questions
The Bullish Power of Three (AMD) describes a three-phase market cycle: accumulation in a range, manipulation below the range to grab liquidity, and distribution as price rallies higher. It is a smart money concept from ICT methodology.
It commonly occurs around session opens (London and New York), on daily candles, and at key support levels where liquidity pools exist below consolidation ranges.
Wait for the manipulation sweep below the accumulation range, then enter long when price reclaims the range. Place your stop below the manipulation low and target higher-timeframe liquidity pools.