Overview
Bullish Rising Window
Mado (窓)
Also known as: Gap Up, Bullish Window, Ku (空)
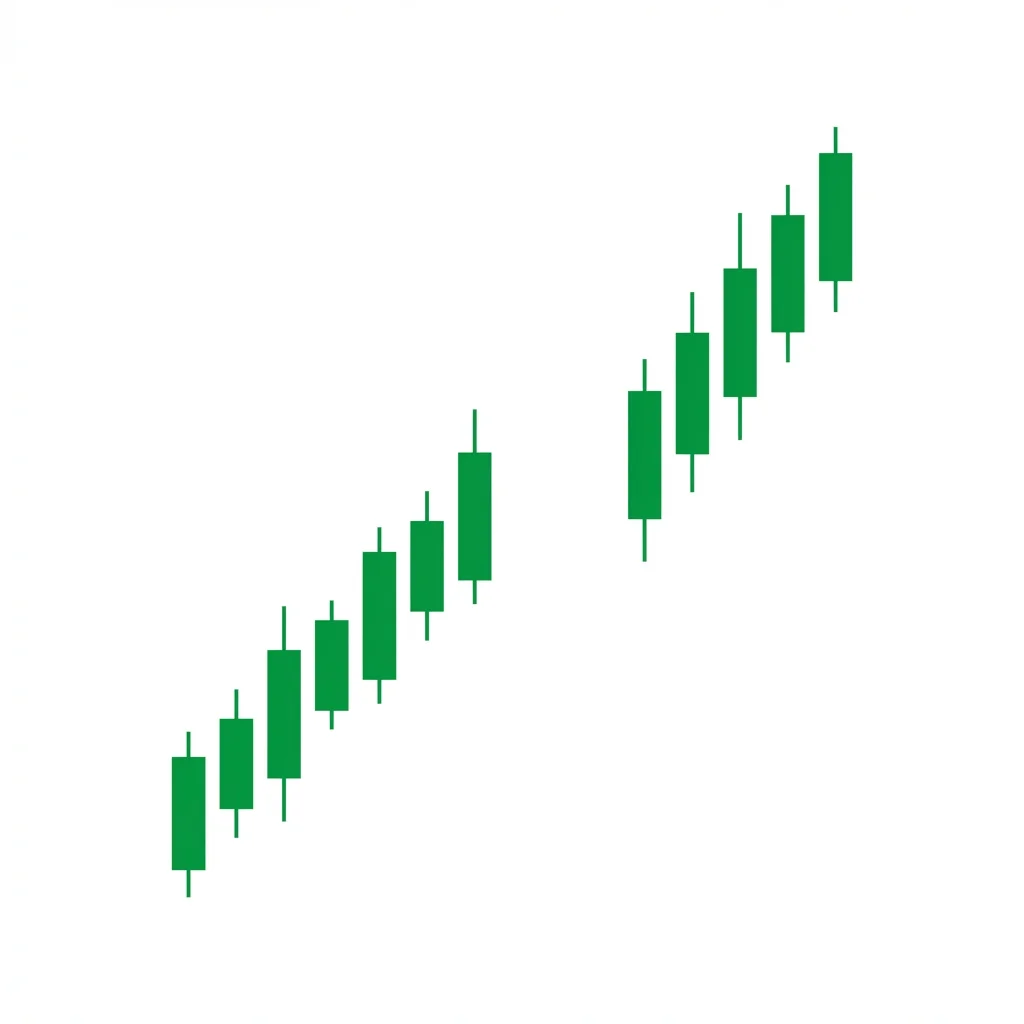
The Bullish Rising Window is a gap-up pattern where the second candle's low is entirely above the first candle's high, creating a visible window (gap) that acts as future support and signals trend continuation.
In Japanese candlestick terminology, a 'window' is equivalent to a Western 'gap.' A Rising Window occurs when price gaps up, leaving a space between consecutive candles where no trading occurred. This gap represents a sudden surge in demand that overwhelms available supply. The unfilled gap acts as a support zone — in Japanese analysis, it is said that 'the window will be closed,' meaning price may return to test the gap but should find support there. As long as the window remains open, the bullish signal is intact.
History & Etymology
The window concept has been central to Japanese candlestick analysis since its origins in Osaka's rice exchange in the 1700s. Japanese traders viewed windows as significant price events that revealed the market's true sentiment. The saying 'close the window' (mado wo umeru) has been a guiding principle for Japanese traders for centuries.
The term 'window' (mado in Japanese) describes the open space on the chart where no trading occurred. Unlike the Western term 'gap,' which focuses on the absence of price, the Japanese term 'window' poetically refers to an opening that allows a view of the underlying market sentiment.
How It Forms
Formation Steps
- 1First candle: any candle in an uptrend
- 2Second candle: opens with a gap above the first candle's high, so the second candle's low is above the first candle's high
Prerequisites
- Existing uptrend or bullish catalyst
- Clear gap between the first candle's high and the second candle's low
- No overlap between the two candles' real bodies or shadows in the gap zone
Confirmation Signals
- Price holds above the gap on subsequent candles
- Volume is elevated on the gap-up candle
- No immediate attempt to fill the gap
Invalidation Signals
- Price immediately fills the gap by trading below the first candle's high
- The gap is filled within 1-3 bars with bearish conviction
- Volume declines after the gap, suggesting exhaustion
Candle Breakdown
Pre-Gap Candle
Any candle in the uptrend; its high establishes the bottom edge of the window
This candle represents normal uptrend behavior. Traders are positioned but the real action comes on the next bar.
Gap-Up Candle
Opens above the first candle's high, with its low remaining above the first candle's high, creating the window
A rush of buying demand at the open drives price above the prior range. Sellers cannot push price back to fill the gap, confirming strong demand.
Psychology
The Rising Window reflects a sudden shift in supply-demand dynamics where buyers are so eager that they bid price above the entire prior candle's range. The gap represents unmet demand and acts as a psychological support level.
Buyer Perspective
Buyers are willing to pay significantly more than the prior session's high, indicating urgency. They view any pullback to the window as a buying opportunity.
Seller Perspective
Sellers are overwhelmed by the sudden demand surge. Those who were short are trapped and must cover at higher prices, adding to the buying pressure.
Smart Money Action
Institutions may have catalyzed the gap through large buy orders at the open. They use any pullback toward the gap as an opportunity to add to positions.
Retail Trader Trap
Retail traders who missed the gap-up often chase at highs and get caught in short-term pullbacks. Others may short the gap expecting a fill, only to be squeezed when the window holds.
Emotional Cycle
Trading Strategy
Aggressive Entry
Enter long on the gap-up candle if it shows bullish momentum during the session.
Conservative Entry
Wait for price to pull back toward the window (gap) and enter when it holds as support.
Previous swing high or 1:1 risk-reward.
The window height projected above the second candle's high.
Next major resistance level or 2:1 risk-reward.
Best Conditions
- Timeframe: daily
- Timeframe: weekly
- Timeframe: 4h
- strong uptrend
- after positive earnings or news
- breakout from consolidation
- Asset: stocks
- Asset: ETFs
- Asset: futures
Avoid When
- Timeframe: 1m
- Timeframe: 5m
- overbought conditions
- end of trend (exhaustion gap)
- low liquidity environments
Confluence Factors
- Gap occurs above a key resistance level (breakaway gap)
- Volume is significantly above average on the gap day
- RSI is not extremely overbought (below 75)
- Gap aligns with a bullish catalyst (earnings, news)
- Prior consolidation pattern (flag, rectangle) is resolved by the gap
Scale In Strategy
Enter a partial position on the gap day and add on a pullback that holds the window as support.
Scale Out Strategy
Take profits at 1:1 R:R and trail the remainder with a moving average stop.
Risk Management
Volume Analysis
Volume Confirmation
Elevated volume on the gap-up candle confirms strong institutional participation.
Volume Profile
High volume on the gap day with declining volume on any pullback toward the window is ideal.
Volume Divergence
If the gap occurs on low volume, it may be an exhaustion gap rather than a continuation gap.
Technical Confluence
Support Resistance
The window itself becomes a support zone. Japanese candlestick theory says the window should act as support on any retest.
Fibonacci Levels
If the gap fills partially, the 50% level of the window often acts as the strongest support within the gap zone.
Moving Averages
Gaps above the 50-day or 200-day moving average are more significant and less likely to be filled quickly.
Rsi Confirmation
RSI should remain above 50 after the gap. RSI above 70 may indicate the gap is an exhaustion gap.
Macd Confirmation
MACD bullish crossover or increasing histogram on the gap day confirms momentum.
Bollinger Bands
A gap above the upper Bollinger Band may signal overextension; gaps within the bands are more sustainable.
Vwap
Price should hold above the developing VWAP on the gap day for the signal to remain valid.
Ichimoku Cloud
Gaps above the Kumo cloud are highly bullish; gaps within or below the cloud have lower reliability.
Elliott Wave
Rising windows often occur at the start of Wave 3 (breakaway gap) or within Wave 3 (runaway gap).
Wyckoff Phase
A gap up during the Sign of Strength in a Wyckoff accumulation schematic confirms the markup phase.
Market Profile
The gap creates a low-volume node (single prints) that acts as strong support on any retest.
Order Flow
The gap represents a price range with no executed orders. Market makers' quotes jumped over this range due to extreme demand imbalance.
Open Interest
In futures, rising open interest on the gap day confirms new long positions and trend conviction.
Multi-Timeframe Analysis
Higher Timeframe Alignment
A daily rising window that aligns with a weekly breakout above resistance is a high-conviction continuation signal.
Lower Timeframe Entry
Use the 15-minute or 1-hour chart to find a pullback entry within the daily window zone.
Timeframe Confluence
A weekly uptrend, daily gap-up window, and 1-hour bullish structure within the window zone is the ideal setup.
Top-Down Approach
Weekly trend direction, daily gap identification, and intraday entry timing at the window support zone.
Statistics
Historical Examples
AMZN Earnings Gap Up
successAMZN gapped up 8% after earnings, creating a clear rising window. The gap was never filled, and the stock rallied an additional 15% over the following weeks.
Lesson: Earnings gaps on strong results in institutional favorites often become breakaway gaps that are never filled.
SPY Breakaway Gap
partialSPY gapped up from a consolidation range. The window held as support on the first test but was eventually filled two weeks later before the uptrend resumed.
Lesson: Even when a window is eventually filled, it often acts as temporary support first, providing a profitable trade before the fill.
Exhaustion Gap Failure
failureTSLA gapped up near the top of an extended rally. The window was filled the next day and price declined sharply — a classic exhaustion gap.
Lesson: Gaps at the end of extended trends are often exhaustion gaps, not continuation gaps. Context and RSI readings help distinguish them.
Variations
Breakaway Window
A gap up that breaks out of a consolidation pattern, signaling the start of a new trend leg.
Exhaustion Window
A gap up at the end of an extended trend that signals the final push before reversal.
Confusion Matrix
Patterns commonly confused with Bullish Rising Window and how to distinguish them.
Bullish Runaway Gap
8000% similarA runaway gap is a specific type of rising window occurring mid-trend. All runaway gaps are rising windows, but not all rising windows are runaway gaps.
Key Differences
- A runaway gap occurs in the middle of a strong trend, often without a specific catalyst
- A rising window is the general term for any bullish gap
Bullish Gap And Go
7500% similarRising Window is the pattern identification; Gap and Go is the aggressive trading approach of entering immediately on the gap.
Key Differences
- Gap and Go emphasizes the immediate continuation after the gap without a pullback
- Rising Window is the general pattern; Gap and Go is a trading strategy for playing the immediate move
A falling window is a Japanese candlestick term for a gap down in price where the high of the current candle is below the low of the previous candle, signaling strong bearish continuation momentum.
The Gap and Go occurs when price gaps up on a catalyst, and instead of filling the gap, continues higher as momentum buying drives the stock to new levels throughout the session.
The Bullish Marubozu is a single candle with no shadows — it opens at the low and closes at the high, representing complete buyer dominance throughout the entire session with no seller resistance.
The Bullish Runaway Gap (Measuring Gap) occurs in the middle of a strong uptrend, signaling that the trend has strong momentum and is likely to continue. It can also be used to project the trend's target — the distance from the trend start to the gap is projected above the gap.
The bearish gap fill rejection occurs when price rallies to fill a prior gap down but is rejected at or within the gap zone, confirming the gap as resistance and signaling continuation of the downtrend.
The bearish gap momentum pattern occurs when price gaps down on high volume and continues selling throughout the session without filling the gap, indicating powerful one-directional selling pressure.
Pro Tips & Common Mistakes
Pro Tips
- Classify the gap: breakaway gaps (from consolidation), runaway gaps (mid-trend), and exhaustion gaps (end of trend) have very different implications
- A window that holds as support on the first test is a strong buy signal — enter at the window bottom with a tight stop below
- Volume is the key differentiator between continuation and exhaustion gaps — high volume on a mid-trend gap is bullish; high volume at the end of an extended move may signal exhaustion
- In Japanese analysis, traders say 'the window must be closed' — use partial gap fills as entry opportunities rather than bearish signals
- Gaps that coincide with fundamental catalysts (earnings, news) are more likely to hold than gaps from technical factors alone
Common Mistakes
- Chasing the gap at the high of the gap day instead of waiting for a pullback to the window
- Assuming all gaps are bullish — exhaustion gaps at the top of trends are bearish signals
- Placing stops too tight inside the window — use the bottom of the window as the stop reference
- Ignoring volume context — low-volume gaps are unreliable
- Not considering the gap type (breakaway vs exhaustion) when planning the trade
Advanced Techniques
- Use the gap zone as a fair value gap (FVG) in smart money concepts — the window often acts as an order block for institutional re-entry
- Measure gap frequency: multiple gaps in sequence (three gap ups) signal increasing momentum but also increasing exhaustion risk
- Combine with opening range breakout strategies: a gap up followed by a break of the first 15-minute high is a powerful setup
- Use options: sell puts at the window support level to collect premium while positioning for the gap to hold
Institutional Perspective
Institutions create gaps through large concentrated orders at the open. They view unfilled gaps as confirmation that their thesis is correct and the market agrees. The window zone represents their cost basis, and they defend it on pullbacks to protect their positions.
Fun Facts
- Japanese traders have a saying: 'The window must be closed' — meaning price tends to eventually revisit the gap zone, but this can take days, weeks, or even months.
- In futures markets, gaps are less common during regular trading hours due to near 24-hour sessions, making gaps on stock charts especially significant.
- The largest single-day gaps in stock market history often became permanent support zones that were never filled, such as several pandemic-recovery gaps in 2020.
Frequently Asked Questions
A Bullish Rising Window is a gap-up pattern where the second candle's low is above the first candle's high, creating a visible gap that acts as future support and signals trend continuation.
No. Approximately 45% of gaps are tested, and some are filled completely. The gap's reliability depends on its type: breakaway gaps are most reliable, while exhaustion gaps often fail.
The conservative approach is to wait for a pullback to the window zone and enter when it holds as support. Aggressive traders can enter on the gap day if volume is strong.