Overview
Bullish Rising Three Methods
Uwa Banare Sanpoo Ohdatekomi
Also known as: Rising Three Methods, Bullish Three Methods
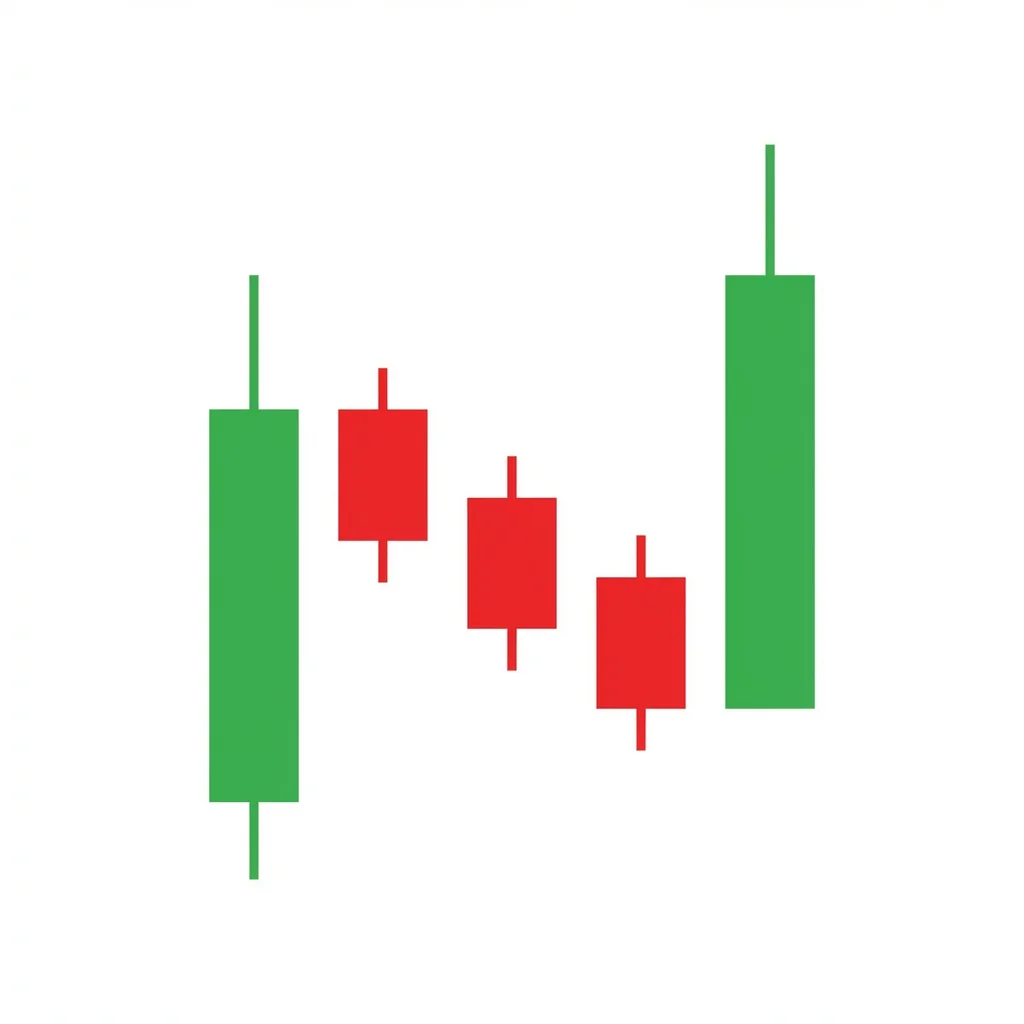
The Rising Three Methods is a five-candle bullish continuation pattern where a long bullish candle is followed by three small bearish candles within its range, then a final bullish candle closes above the first, confirming the uptrend will continue.
This classic Japanese candlestick pattern signals that a brief pullback within an uptrend is merely a rest or consolidation, not a reversal. The first large bullish candle shows strong buyer control. The following small bearish candles represent profit-taking and a minor correction, but they remain within the range of the first candle, showing that sellers cannot push price significantly lower. The final bullish candle resumes the uptrend with conviction, closing above the first candle's high and confirming continuation.
History & Etymology
The Rising Three Methods pattern originated in Japanese rice trading during the 17th and 18th centuries. It was one of the patterns catalogued by Munehisa Homma and is considered one of the most reliable continuation formations in traditional Japanese candlestick analysis. Steve Nison introduced it to Western traders in his foundational works.
The name 'Three Methods' refers to a military strategy concept in Japanese culture. The three small candles represent a strategic retreat or rest before the army (bulls) advances again. The 'rising' prefix indicates the bullish version of this continuation pattern.
How It Forms
Formation Steps
- 1First candle: a long bullish candle in an established uptrend
- 2Middle candles: three (sometimes two or four) small-bodied candles that drift lower, contained within the first candle's range
- 3Last candle: a long bullish candle that closes above the high of the first candle
Prerequisites
- Established uptrend with clear bullish momentum
- First candle has a large real body
- Middle candles stay within the range of the first candle
- Last candle closes above the first candle's close
Confirmation Signals
- The final candle closes above the first candle's high
- Volume increases on the final candle
- Continued upside follow-through on the next bar
Invalidation Signals
- Middle candles close below the first candle's low
- The final candle fails to close above the first candle's high
- Volume expands on the small bearish candles (genuine selling)
Candle Breakdown
First Bullish Candle
A long bullish candle that represents strong buying pressure in the ongoing uptrend
Bulls are firmly in control, driving price higher with conviction. This candle sets the range for the entire pattern.
Small Bearish Candle 1
First of the small corrective candles; represents minor profit-taking
Some traders take profits, but selling is limited. The small body shows bears lack real power.
Small Bearish Candle 2
Second corrective candle continuing the minor pullback within the first candle's range
Selling continues on low volume. Bears appear to be gaining ground but are still confined within the first candle's range.
Small Bearish Candle 3
Third and final corrective candle; the pullback reaches its maximum extent but remains within the first candle's body
The last bearish candle often has the smallest body, indicating that selling momentum is completely exhausted.
Final Bullish Candle
A strong bullish candle that closes above the first candle's high, confirming the continuation
Bulls return with force. Shorts from the pullback are squeezed and new buyers join, creating a powerful surge above the previous high.
Psychology
The Rising Three Methods demonstrates that a brief corrective pullback does not negate the prevailing uptrend. The small bearish candles represent a healthy pause — a rest within the rally — rather than the start of a reversal.
Buyer Perspective
Buyers view the three small bearish candles as an opportunity to add to positions at lower prices. The final bullish candle confirms their thesis and triggers further accumulation.
Seller Perspective
Sellers attempt to reverse the trend during the three-candle pullback but are unable to push price below the first candle's low. When the final candle surges higher, shorts are forced to cover.
Smart Money Action
Institutions use the three-candle pullback to accumulate additional positions at favorable prices, knowing the trend is intact. The final candle often represents their aggressive re-entry.
Retail Trader Trap
Retail traders may short the three bearish candles, believing a reversal is starting. They are trapped when the final bullish candle surges to new highs.
Emotional Cycle
Trading Strategy
Aggressive Entry
Enter long at the close of the final bullish candle.
Conservative Entry
Enter long when the next candle after the pattern confirms by trading above the final candle's high.
1:1 risk-reward ratio or the next resistance level.
Height of the first candle projected above the breakout.
2x the first candle's height or the next major swing high.
Best Conditions
- Timeframe: daily
- Timeframe: weekly
- Timeframe: 4h
- strong uptrend
- trending market
- post-breakout continuation
- Asset: stocks
- Asset: forex
- Asset: crypto
- Asset: commodities
Avoid When
- Timeframe: 1m
- Timeframe: 5m
- choppy or ranging market
- overbought conditions
- bearish macro environment
Confluence Factors
- Pattern forms in a strong established uptrend
- Pullback candles rest on the 10 or 20 EMA
- Volume declines on the pullback and expands on the final candle
- RSI holds above 50 during the pullback
- Pattern forms above key support levels
Scale In Strategy
Enter a partial position at the close of the final candle and add on the first pullback above the pattern.
Scale Out Strategy
Take one-third at the first target, one-third at the second, and trail the final third.
Risk Management
Volume Analysis
Volume Confirmation
Declining volume on the three bearish candles and expanding volume on the final bullish candle is the ideal volume signature.
Volume Profile
Volume should contract during the pullback and expand on the breakout candle.
Volume Divergence
If volume increases on the bearish candles, the pullback may be genuine rather than corrective.
Technical Confluence
Support Resistance
The pullback candles often find support at short-term support levels or the first candle's midpoint.
Fibonacci Levels
The pullback typically reaches the 38.2% to 50% retracement of the first candle — shallow retracements are most bullish.
Moving Averages
The pullback candles often rest on the 10 or 20 EMA, which provides dynamic support in a strong uptrend.
Rsi Confirmation
RSI staying above 50 during the pullback phase confirms that bullish momentum is intact.
Macd Confirmation
MACD remaining positive with the histogram merely contracting (not crossing bearish) during the pullback supports the pattern.
Bollinger Bands
Price pulling back toward the middle Bollinger Band during the three candles before expanding again on the final candle is consistent.
Vwap
Intraday versions should show the pullback candles holding above VWAP.
Ichimoku Cloud
The pullback remaining above the Tenkan-sen and price above the Kumo cloud confirms the uptrend context.
Elliott Wave
The Rising Three Methods often forms within a Wave 3 or Wave 5 impulse, with the pullback representing a minor corrective wave.
Wyckoff Phase
The pattern may occur during the markup phase after a successful reaccumulation.
Market Profile
The pullback candles returning to the prior session's Value Area High before the continuation is a strong signal.
Order Flow
Cumulative delta remaining positive during the pullback and surging on the final candle confirms institutional buying.
Open Interest
Stable or rising open interest during the pattern supports the continuation thesis.
Multi-Timeframe Analysis
Higher Timeframe Alignment
A weekly uptrend with a daily Rising Three Methods provides the strongest confirmation of continuation.
Lower Timeframe Entry
Use the 4-hour chart to time the entry on the final candle of a daily Rising Three Methods.
Timeframe Confluence
Weekly trend up, daily Rising Three Methods identified, 4-hour entry on the breakout candle.
Top-Down Approach
Weekly confirms the trend, daily identifies the pattern, 4-hour optimizes the entry timing.
Statistics
Historical Examples
MSFT Rising Three Methods in Rally
successMSFT printed a textbook Rising Three Methods at $260 during a strong uptrend. Three small bearish candles pulled back to $255 before a strong bullish candle broke to $268.
Lesson: The pattern works best in stocks with strong fundamental trends and institutional sponsorship.
Gold Futures Continuation
successGold formed a Rising Three Methods pattern near $1,820 during its rally to $2,000. The three bearish candles barely retraced before a strong bullish candle continued the rally.
Lesson: In commodity markets with strong macro tailwinds, the Rising Three Methods can be a reliable continuation signal.
Failed Pattern in Weak Trend
failureINTC showed what appeared to be a Rising Three Methods, but the final candle failed to close above the first candle's high. Price subsequently reversed lower.
Lesson: The final candle MUST close above the first candle's high. Without this confirmation, the pattern is not valid.
Variations
Two-Candle Pullback Version
Only two small bearish candles form between the first and final bullish candles.
Four-Candle Pullback Version
Four small bearish candles form between the first and final bullish candles.
Confusion Matrix
Patterns commonly confused with Bullish Rising Three Methods and how to distinguish them.
Bullish Mat Hold
8500% similarCheck for a gap between the first and second candle. If there is a gap up, it may be a Mat Hold. Also, Mat Hold pullback candles can be bullish or bearish.
Key Differences
- Mat Hold has a gap up on the first day and the pullback candles may not all be bearish
- Rising Three Methods has no gap requirement and typically shows three consecutive bearish candles
Bullish Flag
6000% similarRising Three Methods has specific candle count and body requirements. A bull flag is defined by parallel trend lines and can contain many candles.
Key Differences
- A bull flag is a chart formation with parallel downward-sloping boundaries
- Rising Three Methods is a specific candlestick pattern with defined candle requirements
The Bullish Flag is the quintessential continuation pattern: a sharp rally (pole) followed by a brief, tight consolidation (flag) before the next leg up. It represents a healthy pause in a strong uptrend.
The Mat Hold is a five-candle bullish continuation pattern where a strong bullish candle is followed by a brief, shallow pullback of small bearish candles, then a final bullish candle resumes the advance — indicating the trend remains intact.
The Bullish Pennant is a continuation pattern featuring a sharp advance (flagpole) followed by a brief triangular consolidation (pennant), before price breaks out and continues higher with a measured move equal to the flagpole.
The Bearish Breakaway is a five-candle reversal pattern where a gap-up rally stalls over three sessions before a powerful bearish candle breaks back down into the gap, signaling the uptrend is exhausted.
The ladder top is a five-candle bearish reversal pattern where three bullish candles climb like a ladder, a fourth candle shows hesitation, and a fifth bearish candle confirms the reversal by closing below the third candle's close.
The bearish staircase down is a trend continuation pattern characterized by a rhythmic series of lower highs and lower lows, creating a step-like descending structure. Each step represents a decline followed by a partial recovery that fails to reclaim the prior high.
Pro Tips & Common Mistakes
Pro Tips
- The tighter the pullback candles cluster within the first candle's body, the more powerful the continuation signal
- Volume decline on the three middle candles is essential — heavy volume on these candles suggests genuine selling, not a rest
- The pattern is most reliable on daily and weekly charts; intraday versions have higher failure rates
- Combine with trend-following indicators like the 20 EMA for the highest probability trades
- Count the candles carefully — the three middle candles should ideally all be bearish, though one neutral candle is acceptable
Common Mistakes
- Trading the pattern in a weak or unclear trend instead of a strong uptrend
- Entering before the final candle confirms the pattern by closing above the first candle's high
- Ignoring volume — if the pullback candles show increasing volume, the pattern may fail
- Not checking if the middle candles stay within the first candle's range — a violation invalidates the pattern
- Confusing the pattern with a simple pullback that happens to have three bearish candles
Advanced Techniques
- Use the pattern as a continuation entry within larger chart formations like ascending channels or bull flags
- Combine with relative strength analysis — the pattern in a relatively strong stock within a strong sector is highest probability
- Apply order flow analysis to the middle candles to confirm that selling is passive (limit sells) rather than aggressive (market sells)
- Use the pattern as a signal to add to existing winning positions rather than initiating new ones
Institutional Perspective
Institutions view the Rising Three Methods as a sign that the trend is healthy. The controlled pullback shows that profit-taking is orderly and that demand remains robust. They often add to existing positions during the three-candle pullback, viewing it as a discount within a strong trend.
Fun Facts
- The Rising Three Methods is one of the oldest documented candlestick patterns, dating back to Munehisa Homma's rice trading in the 1700s.
- The 'three methods' concept is rooted in Japanese military strategy, where strategic retreats were used to strengthen the final advance.
- Despite its age, modern backtesting confirms the pattern maintains a positive expectancy, especially on daily charts in trending markets.
Frequently Asked Questions
The Rising Three Methods is a five-candle bullish continuation pattern: a long bullish candle, three small bearish candles within its range, and a final bullish candle that closes above the first candle's high, confirming the uptrend will continue.
It is one of the more reliable continuation patterns with a win rate around 65% in trending markets. Its reliability increases with proper volume confirmation and strong trend context.
Traditionally three small bearish candles, but variations with two or four candles are also recognized. The key requirement is that all pullback candles remain within the first candle's range.