Overview
Bullish Selling Climax
Also known as: Capitulation Bottom, Panic Selling Reversal, Climactic Sell-Off
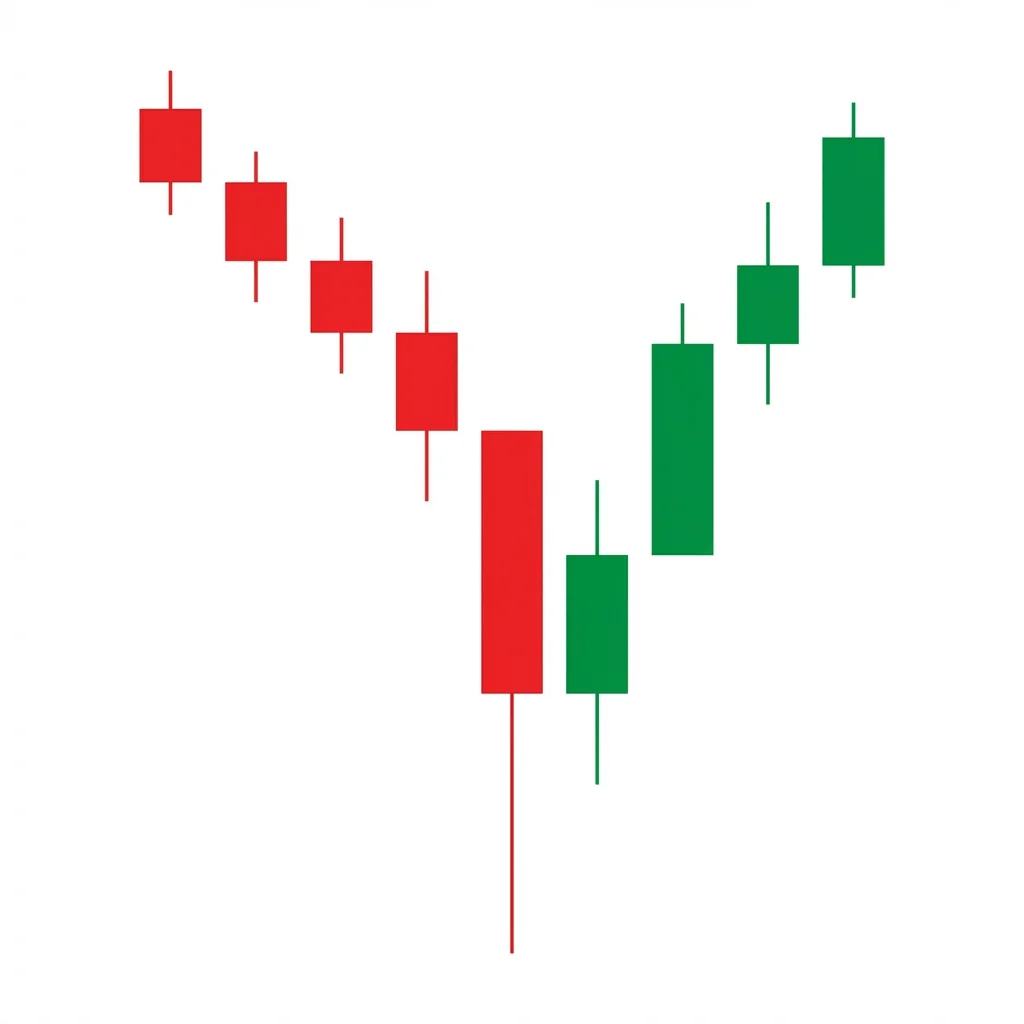
The Bullish Selling Climax occurs when an extended downtrend reaches a point of maximum panic, producing a wide-range bearish candle on extraordinary volume. The exhaustion of selling pressure creates conditions for a sharp reversal as the last sellers capitulate.
A selling climax represents the final act of a downtrend where fear reaches its peak. The climax bar shows dramatically expanded volume and price range as panicked sellers dump their positions. This wave of forced and emotional selling overwhelms all available bids, but once the last sellers are flushed out, there is no one left to sell. Buyers who have been waiting for capitulation step in aggressively, often producing a sharp bounce from the lows. In Wyckoff analysis, the selling climax is a key event in the accumulation schematic that marks the beginning of institutional buying.
History & Etymology
The concept of the selling climax was central to Richard D. Wyckoff's market analysis methodology developed in the 1920s and 1930s. Wyckoff identified the selling climax as the event that transitions the market from the markdown phase to the accumulation phase. The concept predates modern technical analysis and remains one of the most important reversal signals in all of trading.
The term 'climax' comes from the Greek 'klimax' meaning ladder or staircase, referring to a point of greatest intensity. A 'selling climax' is the point where selling intensity reaches its absolute maximum before exhausting itself.
How It Forms
Formation Steps
- 1Climax candle: an extremely wide-range bearish candle with massive volume, often with a long lower shadow indicating a reversal during the session
- 2Recovery candle: a bullish candle that reclaims a significant portion of the climax candle's range
- 3Confirmation candle: continued buying that holds above the climax low
Prerequisites
- Extended downtrend with accelerating selling pressure
- Volume on the climax bar must be dramatically higher than recent average (2-5x or more)
- Wide price range showing panic-driven selling
Confirmation Signals
- Price closes well off its lows on the climax day (long lower shadow)
- Next session opens above the climax close with bullish action
- Volume remains elevated but shifts to the buy side
- Price holds above the climax session low on subsequent tests
Invalidation Signals
- Price breaks below the climax low with continued heavy selling
- No volume expansion — without extreme volume, it is not a true climax
- Subsequent sessions show continued selling with no bounce
Candle Breakdown
Climax Bar
An extremely wide-range candle, often bearish, with volume 2-5x the recent average, frequently showing a long lower shadow as price recovers from intraday lows
Pure panic. Margin calls, forced liquidations, and emotional selling converge to create a volume spike. The long lower shadow shows that buyers stepped in before the session ended.
Recovery Bar
A bullish candle that shows buyers taking control, often with a higher low than the climax bar's low
Smart money aggressively buys at discounted prices. Short covering adds fuel. The mood shifts from fear to tentative hope.
Confirmation Bar
A candle that holds above the climax low and preferably makes a higher high, confirming the selling exhaustion
Traders begin to trust that the bottom is in. Declining volume on any pullback confirms that sellers are exhausted.
Psychology
The selling climax is the emotional peak of a downtrend. All accumulated fear, margin pressure, and pain converge in a single explosive sell-off. When the last panicked seller has dumped their position, the selling pressure evaporates and the stage is set for reversal.
Buyer Perspective
Contrarian and institutional buyers view the selling climax as the opportunity they have been waiting for. They buy aggressively into the panic, knowing that the extreme volume and emotion mark the exhaustion of supply.
Seller Perspective
Sellers are driven by pure panic — margin calls, portfolio rebalancing requirements, and emotional capitulation. Many sell at the worst possible prices, providing liquidity to smart money buyers.
Smart Money Action
Institutions and smart money traders actively buy during the selling climax. They have been waiting for capitulation to provide the liquidity they need to fill large buy orders. The extreme volume ensures their orders are filled without significant slippage.
Retail Trader Trap
Retail traders capitulate at the bottom, selling their positions after enduring extended losses. This emotional selling is exactly what institutional buyers need. Retail traders then miss the reversal and buy back at higher prices.
Emotional Cycle
Trading Strategy
Aggressive Entry
Enter long on the climax day when price shows a strong recovery from the intraday low (long lower shadow) with massive volume.
Conservative Entry
Wait for the recovery bar to close bullish, then enter on a pullback toward the climax close that holds above the climax low.
The prior swing low before the climax (where the final sell-off accelerated).
The 50% retracement of the entire decline that ended with the climax.
The start of the final decline leg or the 200-day moving average.
Best Conditions
- Timeframe: daily
- Timeframe: weekly
- after extended bear markets
- flash crash events
- panic-driven selloffs
- margin call cascades
- Asset: stocks
- Asset: crypto
- Asset: indices
Avoid When
- Timeframe: 1m
- Timeframe: 5m
- Timeframe: 15m
- the selling may not be a true climax in a secular bear market
- low-volatility environments
- orderly declines without capitulation
Confluence Factors
- VIX or fear index at extreme levels
- Put-call ratio at extreme bearish readings
- Price at a major long-term support level
- Sentiment indicators showing maximum bearishness
- Wyckoff accumulation schematic context
Scale In Strategy
Enter a starter position on the climax day, add on the recovery bar, and complete the position on the successful test of the climax low.
Scale Out Strategy
Take one-third at the first retracement target, one-third at the 50% retracement, and trail the final third.
Risk Management
Volume Analysis
Volume Confirmation
The climax bar MUST have extraordinary volume — this is the single most important confirmation element.
Volume Profile
Volume should spike to 2-5x the 20-day average on the climax bar, then gradually decline as the recovery progresses.
Volume Divergence
If subsequent pullbacks show declining volume, it confirms that sellers are exhausted.
Technical Confluence
Support Resistance
The climax low becomes a critical support level. As long as it holds, the reversal thesis is valid.
Fibonacci Levels
The 38.2% and 50% retracement of the prior decline are the first meaningful targets after the climax.
Moving Averages
Price recovering above the 20-day and then 50-day moving average confirms the reversal is gaining traction.
Rsi Confirmation
RSI showing extreme oversold readings (below 20) on the climax bar, followed by a bullish divergence on any retest, is powerful.
Macd Confirmation
MACD histogram contraction and eventual bullish crossover after the climax confirms momentum shift.
Bollinger Bands
Price piercing well below the lower Bollinger Band on the climax before reversing is a classic band squeeze reversal.
Vwap
Price recovering above the VWAP from the climax day confirms that buyers have taken control from the capitulation levels.
Ichimoku Cloud
Recovery above the Tenkan-sen and then the Kijun-sen confirms progressive bullish reclamation.
Elliott Wave
Selling climaxes often mark the end of Wave 5 or Wave C, the terminal waves in Elliott Wave theory.
Wyckoff Phase
The selling climax IS the key Wyckoff event that transitions from markdown to accumulation. It is followed by the Automatic Rally (AR).
Market Profile
Extreme point of control shift on the climax day. Single prints at the climax low confirm a genuine liquidity event.
Order Flow
Massive aggressive selling followed by an abrupt shift to aggressive buying. Delta turns sharply positive at the climax low.
Open Interest
In futures, open interest often drops sharply during the climax as forced liquidations close positions.
Multi-Timeframe Analysis
Higher Timeframe Alignment
A weekly or monthly selling climax is far more significant than a daily one and can mark major market bottoms.
Lower Timeframe Entry
Use the 1-hour chart to identify the exact moment of capitulation within a daily selling climax for a precise entry.
Timeframe Confluence
A weekly climax with a daily recovery candle and 4-hour higher low formation is the highest probability setup.
Top-Down Approach
Monthly/weekly identifies the climax event, daily confirms the recovery, and intraday optimizes entry timing.
Statistics
Historical Examples
COVID Crash Selling Climax
successThe S&P 500 experienced a textbook selling climax on March 23, 2020 with volume 3x the average. The index bottomed at 2,191 and never looked back, rallying 100%+ over the next year.
Lesson: The most powerful selling climaxes occur during genuine crises when sentiment reaches maximum pessimism. Buying the climax is terrifying but often marks generational bottoms.
Bitcoin Capitulation
partialBTC experienced a selling climax near $17,600 with massive volume as overleveraged positions were liquidated. Price rallied to $25,000 before retesting the lows.
Lesson: Crypto selling climaxes can produce sharp bounces, but the accumulation phase may take longer due to the speculative nature of the market.
Failed Climax (Not True Capitulation)
failureNFLX experienced a high-volume selloff after earnings but the decline continued. Volume was elevated but not at true climax levels, and fundamentals continued to deteriorate.
Lesson: Not every high-volume selloff is a true selling climax. Volume must be extraordinary (3-5x average), and the price action must show a recovery from the lows.
Variations
Flash Crash Climax
An extreme selling climax that occurs in minutes rather than hours, often caused by algorithmic cascades.
Slow Climax (Exhaustion Over Multiple Bars)
Selling pressure builds over 2-3 bars before the final climax bar, with volume expanding each day.
Confusion Matrix
Patterns commonly confused with Bullish Selling Climax and how to distinguish them.
Bullish Key Reversal
7500% similarBoth can occur simultaneously. The defining feature of a selling climax is the extraordinary volume — if volume is not extreme, it is more likely a key reversal.
Key Differences
- Key reversal focuses on the single candle's price action (new low then higher close)
- Selling climax emphasizes the extraordinary volume and the exhaustion context
Bullish Hammer
5500% similarA hammer focuses on candle shape; a selling climax focuses on extraordinary volume. A selling climax that also forms a hammer is a very strong signal.
Key Differences
- Hammer is a single-candle pattern defined by its shape (small body, long lower shadow)
- Selling climax is a volume event that may or may not produce a hammer shape
The Buying Climax is a Wyckoff concept describing the final blow-off top where extreme volume and wide price spreads signal that all remaining demand has been absorbed, leaving the market vulnerable to a sharp reversal and the beginning of distribution.
The Bullish Island Reversal is a powerful gap-based reversal pattern where price gaps down to form an isolated cluster, then gaps back up, leaving behind an 'island' of price action that signals a dramatic shift in sentiment.
A Bullish Key Reversal occurs when price makes a new low during a downtrend but reverses to close above the prior bar's high on heavy volume, signaling a dramatic single-day shift in control from sellers to buyers.
The Bullish Outside Reversal is a two-bar pattern where the second bar has a wider range than the first, trading both below its low and above its high before closing bullish. This dramatic range expansion signals a powerful shift from bearish to bullish control.
The Bullish Spring is a Wyckoff pattern where price briefly breaks below trading range support to trigger stop losses, then immediately reverses back above support, trapping shorts and initiating a markup phase.
The Climax Reversal is a wide-range candle that forms at the top of an uptrend, opening strong and reversing to close near the low, signaling that selling pressure has overwhelmed buying and the trend may be exhausted.
Pro Tips & Common Mistakes
Pro Tips
- Volume is the single most important element — without extraordinary volume (3x+ average), it is not a true selling climax
- The best climax signals show a long lower shadow on the climax bar, indicating that buyers stepped in before the session ended
- Expect a retest of the climax low (Wyckoff secondary test) — this retest should occur on declining volume and provides a safer entry
- Combine with sentiment data (VIX, put-call ratio, AAII sentiment) for additional confirmation of maximum pessimism
- The initial bounce after a selling climax can be very sharp — consider entering with a market order rather than waiting for limit fills
Common Mistakes
- Confusing any high-volume down day with a selling climax — true climaxes require extraordinary volume, not just above-average
- Entering without a stop below the climax low — the climax low is your line in the sand
- Expecting an immediate V-bottom — many selling climaxes lead to a trading range (accumulation) before the full recovery
- Selling the initial bounce too quickly — selling climaxes can produce enormous reversals
- Not considering the fundamental context — a selling climax in a fundamentally broken stock may produce only a dead cat bounce
Advanced Techniques
- Use Wyckoff analysis to identify the secondary test after the selling climax — enter at the ST for a lower-risk entry
- Monitor dark pool data and block trades for signs of institutional buying during and after the climax
- Track options market data: a spike in put volume followed by a collapse in implied volatility confirms the climax
- Use tick data or 1-minute charts to identify the exact moment when selling pressure capitulated for intraday entries
Institutional Perspective
Selling climaxes are the events institutions wait for to deploy capital. The extreme volume provides the liquidity they need to build large positions. They view the panic as a gift — the forced and emotional selling of retail and leveraged traders provides institutional buyers with inventory at deeply discounted prices.
Fun Facts
- The COVID crash bottom on March 23, 2020 is one of the most textbook selling climaxes in market history — VIX hit 82 and volume was 4x normal.
- Wyckoff wrote in the 1930s that 'the selling climax is the one event the prepared investor watches for above all others.'
- Studies show that retail investors sell the most on selling climax days, while institutional investors are net buyers — the ultimate contrarian indicator.
Frequently Asked Questions
A Bullish Selling Climax is a reversal event where an extended downtrend culminates in a wide-range, extremely high-volume selloff. The exhaustion of selling pressure creates conditions for a reversal as the last panicked sellers capitulate.
True selling climaxes require extraordinary volume — typically 2-5x the 20-day average. Without this extreme volume, the selloff may not represent genuine capitulation.
Aggressive traders can enter on the climax day if it shows a recovery (long lower shadow). Conservative traders should wait for the recovery bar or the Wyckoff secondary test of the climax low on lower volume.