Overview
Bullish Three Gap Ups
Sanku (三空)
Also known as: Three Rising Windows, Sanku Tops Warning, Triple Gap Up
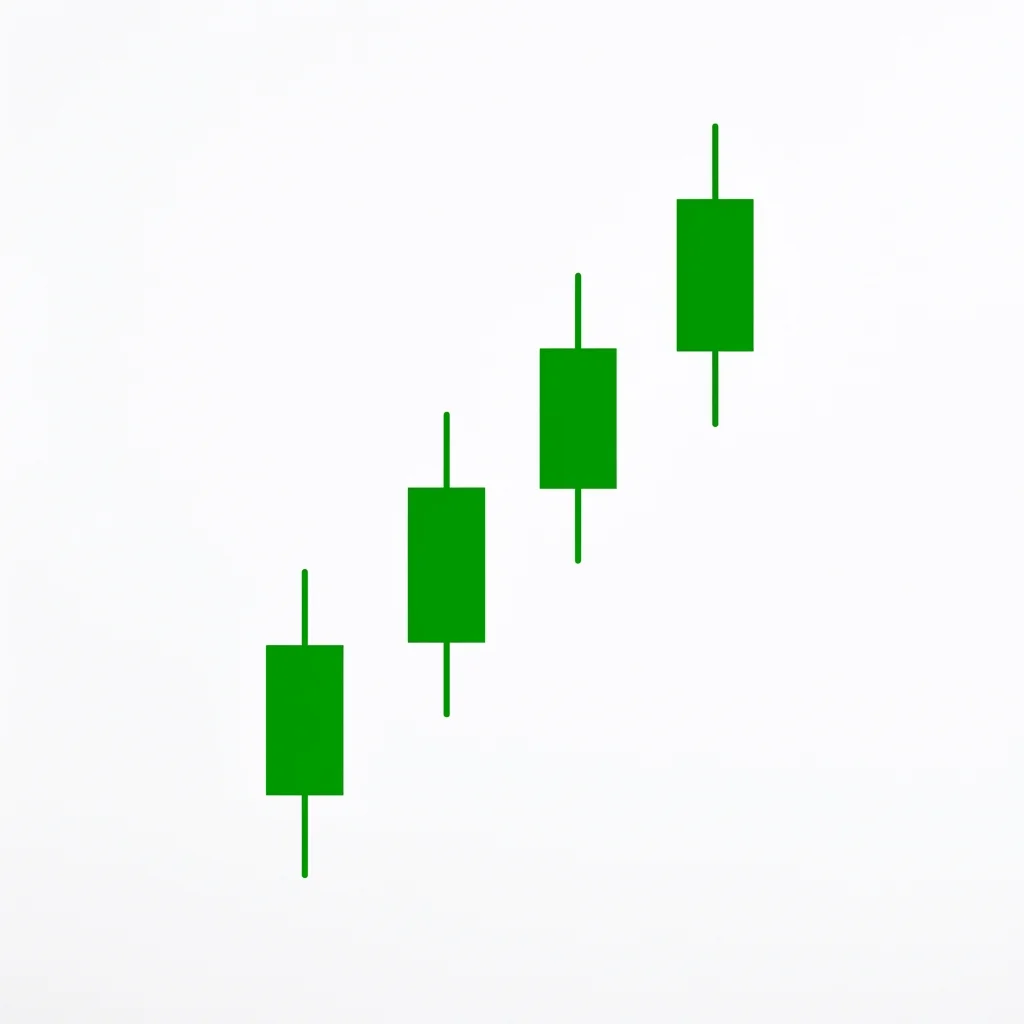
Bullish Three Gap Ups (Sanku) features three consecutive rising windows in a strong uptrend. While initially bullish, Japanese tradition warns that the third gap often signals exhaustion, making this a dual-purpose pattern — continuation in the short term but a potential warning of an impending reversal.
Three consecutive gaps up represent accelerating bullish momentum, with each gap showing increasing demand urgency. However, in traditional Japanese candlestick analysis, the appearance of three gaps (Sanku) is considered a warning sign. The reasoning is that such extreme momentum often precedes exhaustion — the third gap may be an exhaustion gap rather than a continuation gap. Traders should treat the pattern with nuance: the first two gaps confirm trend strength, but the third gap warrants caution as it may mark the climax of the rally.
History & Etymology
The Sanku (three gaps) concept has been central to Japanese candlestick analysis since the 18th century. Japanese rice traders observed that three consecutive gaps in the same direction often preceded a reversal. The saying 'after three gaps, look to sell' has been passed down through generations of Japanese traders.
Sanku (三空) means 'three spaces' or 'three gaps' in Japanese. San (三) means three, and Ku (空) means space or gap. The three gaps represent the three empty spaces between candles where no trading occurred.
How It Forms
Formation Steps
- 1First candle: a bullish candle in an uptrend
- 2Second candle: gaps up from the first (rising window 1)
- 3Third candle: gaps up from the second (rising window 2)
- 4Fourth candle: gaps up from the third (rising window 3)
Prerequisites
- Strong uptrend with accelerating momentum
- Three distinct gaps (windows) between four consecutive candles
- Each gap must be a genuine rising window (low of next candle above high of prior)
Confirmation Signals
- All three gaps remain unfilled
- Volume increases with each successive gap
- Price continues higher after the third gap (initially)
Invalidation Signals
- Any gap is immediately filled
- Volume declines sharply after the third gap
- A strong bearish reversal candle appears after the third gap
Candle Breakdown
First Candle
A bullish candle in the uptrend; its high forms the bottom boundary of the first gap
Strong trend continuation. Buyers are confident and in control.
Second Candle (Gap 1)
Gaps up from the first candle, creating the first rising window
Momentum accelerates. Buyers bid above the prior range, showing urgency. This is likely a runaway gap.
Third Candle (Gap 2)
Gaps up from the second candle, creating the second rising window
Extreme momentum continues. FOMO drives latecomers to buy at any price. The trend is becoming parabolic.
Fourth Candle (Gap 3)
Gaps up from the third candle, creating the third rising window — the potential exhaustion gap
Maximum euphoria or the last surge of buying. The third gap may represent the final burst of demand before sellers emerge. Watch for reversal signals.
Psychology
Three Gap Ups shows a market in the grip of extreme bullish momentum. While initially confirming strength, the pattern warns that momentum cannot accelerate indefinitely. The third gap often marks the point where the last buyers have entered, leaving no one left to buy.
Buyer Perspective
Early buyers who caught the first gap are euphoric. Latecomers chase the second and third gaps out of FOMO. By the third gap, the most speculative and uninformed buyers are entering.
Seller Perspective
Short sellers who have been fighting the trend are squeezed through all three gaps. By the third gap, many have given up entirely. However, smart money may begin selling into the euphoria of the third gap.
Smart Money Action
Institutional traders may ride the first two gaps but begin selling or reducing positions on the third gap, recognizing that three gaps often precede exhaustion. Some may initiate short positions.
Retail Trader Trap
Retail traders, driven by FOMO, buy most aggressively on the third gap — exactly when the pattern is most likely to reverse. They buy the top and are trapped when the reversal begins.
Emotional Cycle
Trading Strategy
Aggressive Entry
Trade the first and second gaps as continuation signals, but begin tightening stops on the third gap.
Conservative Entry
Use the first two gaps to confirm trend strength but avoid initiating new positions on the third gap. Instead, wait for a pullback to one of the gap zones as support.
At or just above the third gap — begin taking profits at the Sanku completion.
Measured move from the first gap to the third gap projected above.
Trail remaining position with a 10 EMA trailing stop.
Best Conditions
- Timeframe: daily
- Timeframe: weekly
- strong bull market rally
- momentum-driven sector rotation
- after breakout from major consolidation
- Asset: stocks
- Asset: crypto
- Asset: futures
Avoid When
- Timeframe: 1m
- Timeframe: 5m
- Timeframe: 15m
- late-stage rally
- overbought conditions
- approaching major resistance
Confluence Factors
- First and second gaps serve as continuation confirmation
- ADX above 30 confirms strong trend
- RSI approaching overbought (70-80) warns of potential exhaustion on the third gap
- Volume expanding on each gap
- No overhead resistance near the third gap
Scale In Strategy
Enter on the first gap and add on the second. Do not add on the third gap — begin scaling out instead.
Scale Out Strategy
Take one-third profit on the second gap, another third on the third gap, and trail the rest with tight stops.
Risk Management
Volume Analysis
Volume Confirmation
Increasing volume on each gap confirms accelerating momentum but also increases exhaustion risk on the third gap.
Volume Profile
Volume should build on each gap. Extremely high volume on the third gap often confirms exhaustion.
Volume Divergence
If volume declines on the second or third gap, momentum may be fading faster than expected.
Technical Confluence
Support Resistance
Each gap zone becomes a support level. The first gap is strongest; the third is most vulnerable to being filled.
Fibonacci Levels
The third gap often overshoots common Fibonacci extension levels, suggesting exhaustion.
Moving Averages
Price far above the 20 EMA after three gaps suggests overextension. A mean reversion to the 20 EMA is likely.
Rsi Confirmation
RSI above 70-80 after three gaps is a classic overbought warning. Bearish divergence on the third gap is very significant.
Macd Confirmation
MACD histogram peaking on the third gap with signs of rollover warns of momentum exhaustion.
Bollinger Bands
Price well above the upper Bollinger Band after three gaps signals extreme overextension.
Vwap
Price far above VWAP after three gaps confirms overextension. A reversion to VWAP is likely.
Ichimoku Cloud
Price far above the Kumo cloud after three gaps is extremely overextended by Ichimoku standards.
Elliott Wave
Three gaps frequently occur within Wave 3 or the final stages of Wave 5.
Wyckoff Phase
Three gaps in the markup phase may signal an approaching buying climax.
Market Profile
Single prints across all three gap zones on the market profile confirm genuine liquidity voids.
Order Flow
Delta peaks on the third gap. If delta begins declining, the momentum is shifting.
Open Interest
Rapid open interest expansion across three gaps in futures suggests speculative froth.
Multi-Timeframe Analysis
Higher Timeframe Alignment
Weekly three gaps are more significant than daily ones. Monthly three gaps can mark multi-year tops.
Lower Timeframe Entry
Use intraday charts to identify the third gap's reversal potential for timing profit-taking.
Timeframe Confluence
Daily three gaps within a weekly uptrend — take profits on the third gap and look for support at the second gap zone.
Top-Down Approach
Weekly trend assessment, daily gap counting, and intraday reversal signals for the third gap.
Statistics
Historical Examples
Tesla 2020 Three Gap Rally
partialTSLA produced three consecutive gap ups during its pre-split rally. The third gap marked a short-term top before a brief pullback, though the broader rally continued.
Lesson: Even in the strongest rallies, the third gap often produces at least a short-term pullback. Taking partial profits is wise.
Bitcoin Three Gap Surge
successBTC produced three gap ups around $40,000 during the institutional adoption rally. The third gap did not immediately reverse, and BTC continued to $58,000.
Lesson: In very strong fundamental-driven rallies, the Sanku exhaustion warning may not materialize immediately.
Exhaustion After Three Gaps
failureGME produced multiple gaps during the meme stock rally. The third gap at $380+ marked the exact top before the stock crashed back below $50.
Lesson: The Sanku exhaustion warning is most reliable in speculative, momentum-driven rallies without fundamental support.
Variations
Accelerating Three Gaps
Each gap is larger than the previous one, showing accelerating momentum.
Decelerating Three Gaps
Each gap is smaller than the previous one, showing decelerating momentum.
Confusion Matrix
Patterns commonly confused with Bullish Three Gap Ups and how to distinguish them.
Bullish Runaway Gap
7000% similarCount the gaps. A single gap mid-trend is a runaway gap. Three consecutive gaps form the Sanku pattern.
Key Differences
- Runaway gap is a single mid-trend gap
- Three Gap Ups is a sequence of three consecutive gaps
Three gap downs (San Ku) feature three consecutive downward gaps in a downtrend. While initially bearish, the third gap often signals selling exhaustion and a potential reversal. Traders must decide if the gaps represent momentum continuation or capitulation.
The Bullish Rising Window is a gap-up pattern where the second candle's low is entirely above the first candle's high, creating a visible window (gap) that acts as future support and signals trend continuation.
The Bullish Runaway Gap (Measuring Gap) occurs in the middle of a strong uptrend, signaling that the trend has strong momentum and is likely to continue. It can also be used to project the trend's target — the distance from the trend start to the gap is projected above the gap.
A falling window is a Japanese candlestick term for a gap down in price where the high of the current candle is below the low of the previous candle, signaling strong bearish continuation momentum.
The bearish gap fill rejection occurs when price rallies to fill a prior gap down but is rejected at or within the gap zone, confirming the gap as resistance and signaling continuation of the downtrend.
The bearish gap momentum pattern occurs when price gaps down on high volume and continues selling throughout the session without filling the gap, indicating powerful one-directional selling pressure.
Pro Tips & Common Mistakes
Pro Tips
- Japanese tradition says 'after three gaps, look to sell' — respect this wisdom, especially in speculative rallies
- The first gap is usually breakaway (most reliable), the second is runaway (still reliable), and the third is often exhaustion (trade with caution)
- Volume profile matters: if volume declines on each successive gap, the pattern is weaker; if it increases, the pattern is stronger but also more likely to exhaust
- Use the pattern for profit-taking rather than fresh entries — take profits on the third gap and look for a pullback to re-enter
- The gap zones become future support levels; if the third gap fills but the second holds, the trend may resume
Common Mistakes
- Buying aggressively on the third gap out of FOMO — this is statistically the worst entry point
- Ignoring the Sanku exhaustion warning in speculative rallies
- Not taking any profits when three gaps appear — always take at least partial profits
- Assuming the trend is over after three gaps — sometimes the trend pauses and continues after filling the third gap
- Not adjusting position size as the pattern develops — reduce exposure with each successive gap
Advanced Techniques
- Use the gap zones as a map for future pullback entries — the second gap zone is often the best re-entry after a pullback
- Monitor put-call ratios and options skew after the third gap for signs of institutional hedging
- Apply Elliott Wave analysis to determine if the third gap marks a Wave 3 extension (continuation likely) or Wave 5 terminal (reversal likely)
- Use the first gap as an anchored VWAP starting point to track institutional cost basis through the rally
Institutional Perspective
Institutions typically initiate positions before the first gap and begin reducing exposure by the third gap. They recognize that three consecutive gaps attract the most speculative retail buying, which provides the liquidity they need to distribute positions. The third gap is where smart money sells to dumb money.
Fun Facts
- The Japanese saying 'Sanku no ato wa ure' (after three gaps, sell) has been used by traders for over 300 years.
- Statistical analysis shows that the third gap is filled within 10 bars approximately 65% of the time, supporting the traditional exhaustion interpretation.
- Three consecutive gap ups in major indices (like the S&P 500) are extremely rare — occurring less than once per year on average.
Frequently Asked Questions
The Three Gap Ups pattern features three consecutive rising windows (gaps up) in a strong uptrend. While the first two gaps confirm trend strength, the third gap is traditionally viewed as an exhaustion warning.
Japanese tradition says 'after three gaps, look to sell.' The third gap is best used for taking profits rather than initiating new long positions. If you are already long, tighten your trailing stop.
Not necessarily. The third gap is most likely to be filled (65% of the time). The second and first gaps may act as support on any pullback. If the first gap fills, the trend may have reversed entirely.