Overview
Doji
Doji (同事)
Also known as: Doji Star, Standard Doji, Neutral Doji
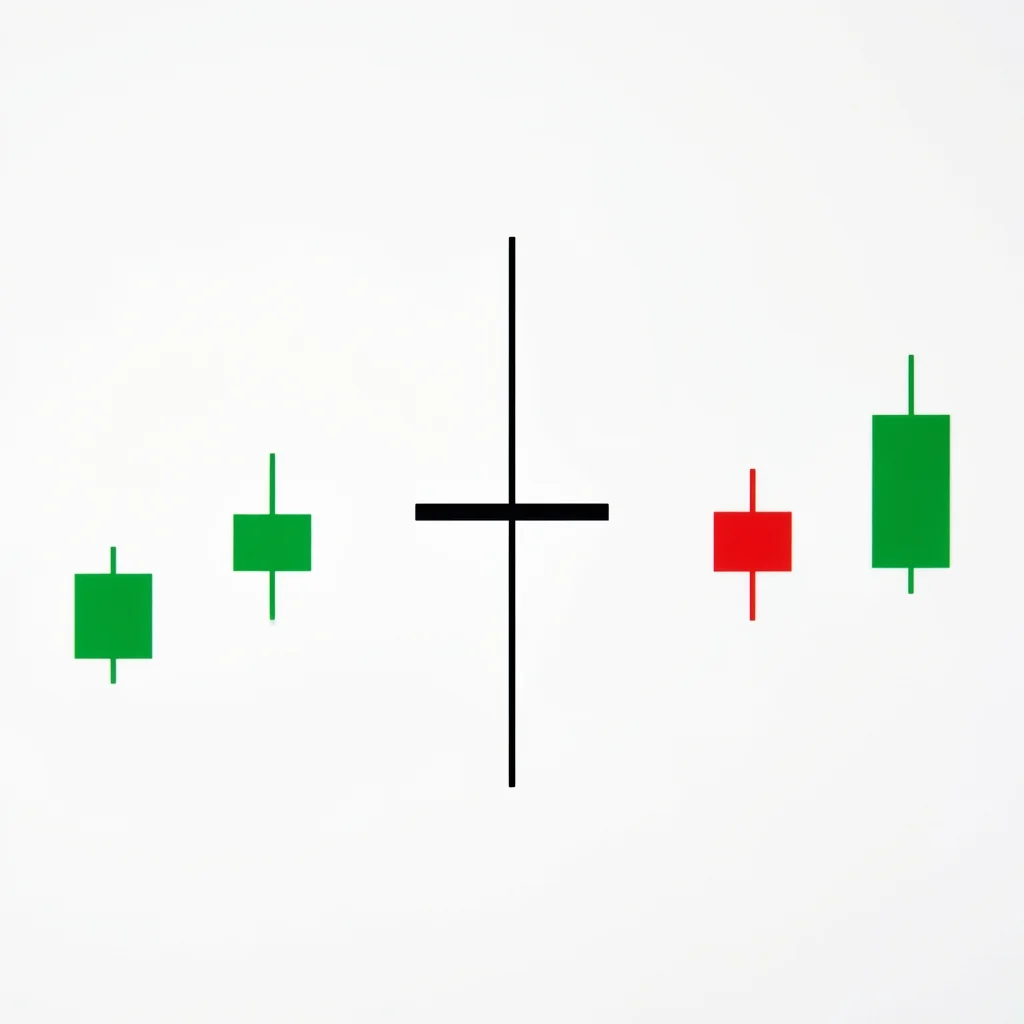
The Doji is the quintessential indecision candle where opening and closing prices are virtually identical, reflecting a perfect tug-of-war between buyers and sellers.
The Doji is formed when a security's open and close are nearly equal, producing a very small or nonexistent real body. The resulting candle resembles a cross, plus sign, or inverted cross depending on shadow lengths. A Doji signals that neither buyers nor sellers gained ground during the session, creating a state of equilibrium. While the Doji alone is not a directional signal, its context within a trend or at key levels makes it one of the most important candles in technical analysis. After a strong trend, a Doji warns that momentum may be fading and a reversal or pause is possible.
History & Etymology
The Doji originates from Japanese rice trading in the 18th century and is one of the oldest recognized candlestick formations. The concept of 'doji' days was central to Munehisa Homma's trading philosophy, where he viewed them as moments of market reflection. Steve Nison popularized the pattern globally in the 1990s.
The word 'doji' comes from the Japanese term meaning 'the same thing', referring to the fact that the opening and closing prices are the same. In Buddhist context, doji can also imply a state of indifference or balance.
How It Forms
Formation Steps
- 1Single candle where the open and close are at or very near the same price
- 2Upper and lower shadows can vary in length but are typically present
Prerequisites
- Can appear in any trend context
- Open and close prices must be within a few ticks of each other
- Real body is negligibly small relative to the overall range
Confirmation Signals
- Next candle closes decisively in one direction
- Volume spike on the following candle confirms breakout direction
- Gap away from the doji in either direction
Invalidation Signals
- Continued sideways price action with no follow-through
- Doji forms in the middle of a range with no contextual significance
- No volume change on subsequent candles
Candle Breakdown
Doji Candle
A single candle with virtually no real body, indicating that the opening and closing prices are nearly equal
The market opened, moved in both directions during the session, but ultimately closed where it started. Neither side won the battle, creating a moment of pure indecision.
Psychology
The Doji represents a psychological standoff between buyers and sellers. The session saw price exploration in both directions, but the market returned to equilibrium by the close. This pattern signals that the prevailing trend force is losing conviction.
Buyer Perspective
Buyers pushed price higher during the session but could not hold gains. If appearing after a downtrend, buyers see it as sellers losing steam and may prepare for long entries on confirmation.
Seller Perspective
Sellers pushed price lower during the session but could not maintain control. If appearing after an uptrend, sellers see fading buying pressure and may prepare for short entries on confirmation.
Smart Money Action
Institutional traders use doji candles as alerts to tighten stops and reduce position sizes. They rarely act on a doji alone but view it as a preliminary signal to prepare for a potential shift in order flow.
Retail Trader Trap
Retail traders often overreact to doji candles, entering trades prematurely without confirmation. This leads to whipsaws when the market resumes its prior trend instead of reversing.
Emotional Cycle
Trading Strategy
Aggressive Entry
Enter in the direction of the expected move at the close of the doji, using the opposite shadow extreme as the stop loss.
Conservative Entry
Wait for the next candle to close above the doji high (bullish) or below the doji low (bearish) before entering.
1:1 risk-reward ratio based on the doji range.
Next significant support or resistance level.
2:1 risk-reward ratio or measured move from the prior trend leg.
Best Conditions
- Timeframe: daily
- Timeframe: 4h
- Timeframe: weekly
- after extended trends
- at key support/resistance
- at Fibonacci levels
- Asset: stocks
- Asset: forex
- Asset: indices
Avoid When
- Timeframe: 1m
- Timeframe: 5m
- Timeframe: 15m
- choppy sideways markets
- low volatility environments
- during consolidation ranges
Confluence Factors
- Doji forms at a key support or resistance level
- RSI is overbought or oversold
- Doji appears at a moving average confluence
- Fibonacci retracement or extension level alignment
- Bollinger Band extreme touch
Scale In Strategy
Add to position only after the confirmation candle closes in the expected direction and volume increases.
Scale Out Strategy
Exit one-third at TP1, another third at TP2, and trail the remainder.
Risk Management
Volume Analysis
Volume Confirmation
Average or below-average volume on the doji itself; look for a volume surge on the confirmation candle.
Volume Profile
Low volume on the doji suggests lack of conviction; high volume suggests active battle between buyers and sellers, which is more significant.
Volume Divergence
Declining volume leading into the doji during a trend suggests exhaustion and increases reversal probability.
Technical Confluence
Support Resistance
Doji at major support or resistance levels dramatically increases the probability of a reversal or significant reaction.
Fibonacci Levels
A doji at the 50% or 61.8% retracement level is a high-probability setup for a directional move.
Moving Averages
Doji forming at the 20, 50, or 200 EMA often marks a decision point where the trend will either continue or reverse.
Rsi Confirmation
RSI at extreme levels (above 70 or below 30) combined with a doji significantly increases reversal probability.
Macd Confirmation
MACD histogram approaching zero or crossing at the time of a doji validates the loss of momentum.
Bollinger Bands
A doji at the upper or lower Bollinger Band signals a potential mean reversion trade.
Vwap
Doji near VWAP during intraday trading marks a key equilibrium point; watch for directional breakout.
Ichimoku Cloud
Doji at the cloud edge signals potential support/resistance reaction within the Ichimoku framework.
Elliott Wave
Doji candles frequently appear at the terminal points of impulse waves (end of Wave 3 or Wave 5).
Wyckoff Phase
Doji can signal the Preliminary Support (PS) or Preliminary Supply (PSY) phases in Wyckoff analysis.
Market Profile
Doji at the Point of Control or Value Area boundary indicates a high-probability reaction zone.
Order Flow
Equal buying and selling pressure visible in the tape confirms the indecision shown by the doji formation.
Open Interest
Flat or declining open interest on a doji day suggests position liquidation rather than new positioning.
Multi-Timeframe Analysis
Higher Timeframe Alignment
A doji on the daily chart is most significant when it aligns with a weekly support/resistance level or trend exhaustion.
Lower Timeframe Entry
After a daily doji, drop to the 1-hour chart to find a breakout of the doji range for precise entry.
Timeframe Confluence
Doji appearing simultaneously on multiple timeframes (e.g., daily and weekly) dramatically increases the significance of the signal.
Top-Down Approach
Identify the macro trend on the weekly chart, find key levels on the daily, then use the doji on the 4-hour as an entry trigger.
Statistics
Historical Examples
S&P 500 Doji at All-Time High
successSPX printed a doji at its all-time high near 4,740. The following session gapped down, initiating a correction that lasted several weeks.
Lesson: Doji at all-time highs after extended rallies are powerful exhaustion signals worth respecting.
Bitcoin Doji During Consolidation
failureBTC formed a doji near $26,000 during a sideways range. Price continued to chop sideways with no clear follow-through in either direction.
Lesson: Doji in the middle of a range offers no edge. Context matters more than the candle itself.
EUR/USD Doji at Support
successEUR/USD printed a doji at the 0.9535 support level. A bullish confirmation candle followed, leading to a 200-pip bounce.
Lesson: Doji at well-defined support or resistance levels with confirmation candles provide high-probability trades.
Variations
Long-Legged Doji
A doji with exceptionally long upper and lower shadows, indicating extreme intraday volatility and indecision.
Four-Price Doji
A doji where the open, high, low, and close are all the same price, appearing as a horizontal line.
Confusion Matrix
Patterns commonly confused with Doji and how to distinguish them.
Neutral Spinning Top
8000% similarIf there is any discernible real body, it is a Spinning Top. A true Doji has no real body.
Key Differences
- Spinning Top has a small but visible real body
- Doji has virtually no real body (open equals close)
Neutral Long Legged Doji
8500% similarCompare shadow lengths to recent candles. If shadows are significantly longer than average, it is a Long-Legged Doji.
Key Differences
- Long-Legged Doji has exceptionally long upper and lower shadows
- Standard Doji has moderate shadow lengths
The Four-Price Doji is the rarest doji variant where all four price points (open, high, low, close) are identical, appearing as a horizontal line and signaling complete market inactivity or perfect equilibrium.
The High Wave candle features a small body with extremely long upper and lower shadows, signaling intense intraday volatility and extreme indecision that often precedes a significant directional move.
The Long-Legged Doji features extremely long shadows in both directions with the open and close near the center, representing the most extreme form of single-candle indecision and a potent warning of momentum exhaustion.
The Rickshaw Man is a specialized long-legged doji where the open and close are positioned exactly at the midpoint of the candle's range, representing the purest expression of market indecision with perfectly balanced shadows.
The Spinning Top is one of the most common candlestick patterns, featuring a small real body with shadows on both sides, indicating mild to moderate indecision where neither buyers nor sellers gained meaningful ground.
The Bearish Belt Hold is a single bearish candle that opens at its high and closes near its low with a long body, indicating that sellers dominated from the opening bell and controlled price action throughout the session.
Pro Tips & Common Mistakes
Pro Tips
- Never trade a doji in isolation — always wait for the next candle to confirm direction
- The location of the doji matters more than the doji itself: at trend extremes it is meaningful, mid-range it is noise
- Multiple consecutive doji candles increase the probability of a significant breakout
- Use the doji high and low as a breakout trigger zone for the next trade
- Volume on the doji should be compared to recent average to assess significance
Common Mistakes
- Trading the doji without waiting for directional confirmation
- Treating every doji as a reversal signal regardless of context
- Ignoring the prior trend when interpreting the doji's meaning
- Setting stops too tight within the doji range, leading to premature stop-outs
- Overtrading doji signals in choppy, range-bound markets
Advanced Techniques
- Use the doji as a volatility compression signal — place buy stop above and sell stop below for a straddle-style breakout trade
- Combine doji with volume profile analysis to identify whether it forms at a high-volume or low-volume node
- On lower timeframes, the doji often resolves into a clear range pattern that can be traded with mean reversion strategies
- Use implied volatility readings alongside doji to gauge whether the market is pricing in a major move
Institutional Perspective
Institutions view doji candles as alerts rather than signals. Market makers note the equilibrium and prepare for increased order flow. Large funds may use the doji session to quietly build positions before the expected directional move, especially at technically significant levels.
Fun Facts
- The Doji is considered the single most important candlestick in Japanese charting tradition, as it represents the moment of perfect market balance.
- Munehisa Homma, the father of candlestick charting, reportedly used doji days as key decision points in his rice trading strategy in 1700s Japan.
- The Doji appears in roughly 5-8% of all daily candles across major markets, making it one of the most common single-candle patterns.
Frequently Asked Questions
A Doji indicates that buyers and sellers are in equilibrium. The open and close are virtually the same, meaning neither side gained ground during the session. It signals indecision and a potential turning point.
A Doji is inherently neutral. Its directional implication depends entirely on context — after an uptrend it can signal bearish reversal, after a downtrend it can signal bullish reversal, and in a range it may mean nothing.
Never trade a Doji alone. Wait for confirmation from the next candle, check for confluence with support/resistance levels and indicators, and always use a stop loss beyond the doji's range.