Overview
Rickshaw Man
Jinrikisha (人力車)
Also known as: Centered Doji, Perfect Long-Legged Doji, Balanced Doji
The Rickshaw Man is a specialized long-legged doji where the open and close are positioned exactly at the midpoint of the candle's range, representing the purest expression of market indecision with perfectly balanced shadows.
The Rickshaw Man is a specific subtype of the long-legged doji where the open and close occur precisely at the center of the high-low range. This creates perfectly symmetrical shadows above and below the open/close level. The symmetry is key — it shows that buyers and sellers explored equal distances from the equilibrium point and returned to perfect center. This candle represents the ultimate state of market balance, where the upward and downward forces are mathematically equal. After a trend, the Rickshaw Man is a strong warning that the trend's energy has been perfectly neutralized.
History & Etymology
The Rickshaw Man was identified in classical Japanese candlestick analysis and named after the human-powered rickshaw carriers common in Japanese cities. The imagery of a man straining equally in both directions while ultimately going nowhere captures the candle's meaning perfectly.
Named after the Japanese rickshaw (jinrikisha) puller who strains forward but must also brace backward, creating equal effort in opposing directions. The candle's equal shadows mirror this balanced effort that produces no net movement.
How It Forms
Formation Steps
- 1Single doji candle with open and close at the exact midpoint of the high-low range
- 2Long upper shadow extending well above the midpoint
- 3Long lower shadow extending well below the midpoint, roughly equal to the upper shadow
Prerequisites
- Open and close must be virtually identical (doji)
- Open/close must be at or very near the exact center of the high-low range
- Both shadows must be long and approximately equal in length
Confirmation Signals
- Decisive directional candle on the following session
- Break of the Rickshaw Man's high or low with volume
- Gap in either direction on the next candle
Invalidation Signals
- Another indecision candle with no resolution
- Price remains within the doji range
- Declining volume with no directional commitment
Candle Breakdown
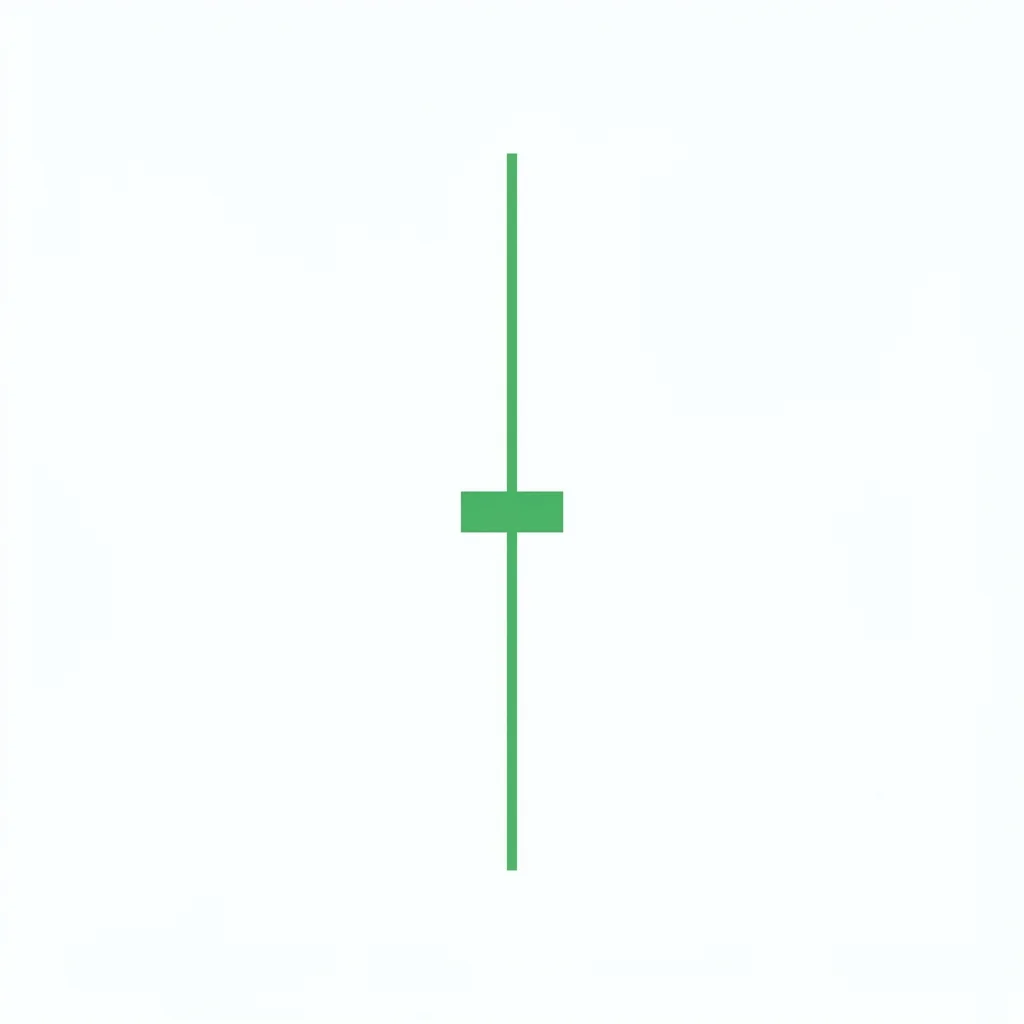
Rickshaw Man Candle
A perfectly centered doji with equal long shadows, showing symmetrical price exploration in both directions that resolved at the exact midpoint
The market explored upside and downside in exactly equal measure. This mathematical perfection of indecision is rare and significant. It shows that the forces driving price higher and lower are in perfect equilibrium.
Psychology
The Rickshaw Man represents mathematically perfect indecision. Unlike asymmetric doji where one shadow is longer, the Rickshaw Man's equal shadows show that buying and selling pressure were precisely matched. This perfect balance is a more powerful signal than ordinary indecision because it shows the market has found an exact equilibrium point.
Buyer Perspective
Buyers note that they pushed price to a significant high during the session. However, sellers matched their effort exactly. There is no asymmetric edge to exploit — the market is truly balanced.
Seller Perspective
Sellers drove price equally far below the open. However, buyers recovered with equal strength. The symmetric effort provides no edge for the bearish thesis either.
Smart Money Action
Institutional traders recognize the Rickshaw Man as a perfect equilibrium session. They may have been the ones creating it — buying the lows and selling the highs in equal measure to accumulate a range position before the breakout.
Retail Trader Trap
Retail traders experience maximum whipsaw during the Rickshaw Man session, buying highs and selling lows as the market oscillates. The symmetric movement is especially disorienting.
Emotional Cycle
Trading Strategy
Aggressive Entry
Place bracket orders above the high and below the low, entering whichever direction triggers first.
Conservative Entry
Wait for a close beyond the Rickshaw Man's high or low on the following candle before entering.
1:1 risk-reward based on the full Rickshaw Man range.
Next significant support or resistance level.
Measured move equal to the Rickshaw Man's full range projected from the breakout.
Best Conditions
- Timeframe: daily
- Timeframe: 4h
- Timeframe: weekly
- after extended trends
- at major technical levels
- before catalytic events
- Asset: stocks
- Asset: forex
- Asset: crypto
Avoid When
- Timeframe: 1m
- Timeframe: 5m
- Timeframe: 15m
- choppy mid-range markets
- low-volatility environments
Confluence Factors
- Rickshaw Man at a major support or resistance level
- RSI at extreme levels during the pattern
- Moving average confluence at the open/close level
- Fibonacci level alignment at the midpoint
- Bollinger Band expansion coinciding with the pattern
Scale In Strategy
Enter small on the breakout, add on pullback retest of the Rickshaw Man midpoint.
Scale Out Strategy
Exit half at 1:1 R:R, trail the remainder.
Risk Management
Volume Analysis
Volume Confirmation
High volume on the Rickshaw Man confirms genuine bilateral activity. Volume increase on breakout validates direction.
Volume Profile
Equal volume at both shadow extremes is the ideal profile, confirming the symmetric participation.
Volume Divergence
If volume is asymmetric (more at one extreme), that extreme is where institutional interest lies.
Technical Confluence
Support Resistance
The Rickshaw Man's midpoint and shadow extremes all become significant reference levels.
Fibonacci Levels
If the midpoint aligns with a key Fibonacci level, the equilibrium point has added significance.
Moving Averages
Rickshaw Man centered on a major moving average suggests the trend-defining level is perfectly balanced.
Rsi Confirmation
RSI near 50 during the Rickshaw Man confirms the perfect balance between bullish and bearish forces.
Macd Confirmation
MACD at zero during the Rickshaw Man session validates the complete absence of momentum bias.
Bollinger Bands
Both shadows touching the Bollinger Bands confirms maximum volatility within perfect balance.
Vwap
VWAP at the exact midpoint of the Rickshaw Man confirms the volume-weighted equilibrium.
Ichimoku Cloud
Rickshaw Man with the midpoint at the cloud boundary creates a clear decision point.
Elliott Wave
May mark the exact terminal point of a wave, where the trend force is perfectly neutralized.
Wyckoff Phase
Can represent the Secondary Test (ST) in Wyckoff, where the market tests equilibrium before moving.
Market Profile
The Point of Control aligns with the Rickshaw Man's midpoint, confirming the balance.
Order Flow
Zero cumulative delta at the close confirms the mathematical balance between buying and selling.
Open Interest
Flat open interest during the session confirms no net positioning change.
Multi-Timeframe Analysis
Higher Timeframe Alignment
A daily Rickshaw Man at a weekly support/resistance level is a high-impact signal.
Lower Timeframe Entry
After a daily Rickshaw Man, use the 1-hour chart to enter on the breakout of the range.
Timeframe Confluence
Rickshaw Man on both daily and 4-hour charts at the same level confirms maximum indecision.
Top-Down Approach
Weekly trend provides directional bias. Daily Rickshaw Man identifies the equilibrium. 4-hour provides entry.
Statistics
Historical Examples
S&P 500 Rickshaw Man at Key Level
successSPX printed a Rickshaw Man at the 4,200 level with perfectly symmetric 40-point shadows. The next day broke lower, initiating a pullback to 3,900.
Lesson: Rickshaw Man at psychologically significant round numbers can signal major turning points.
Gold Rickshaw Man During Consolidation
failureGold formed a Rickshaw Man at $2,020 during sideways trading. The pattern produced no meaningful directional move as range-bound conditions persisted.
Lesson: In range-bound markets, the Rickshaw Man merely confirms the ongoing indecision rather than predicting a breakout.
Ethereum Rickshaw Man Before Rally
successETH formed a weekly Rickshaw Man at $1,600 with $100 symmetric shadows. The following week broke higher, initiating a rally to $2,100.
Lesson: Weekly Rickshaw Man candles are rare and highly significant, especially when followed by a strong directional candle.
Variations
Near-Perfect Rickshaw Man
A long-legged doji where the open/close is very close to the midpoint but not mathematically exact.
Confusion Matrix
Patterns commonly confused with Rickshaw Man and how to distinguish them.
Neutral Long Legged Doji
9000% similarMeasure the midpoint of the high-low range. If the open/close is at the exact center (or within a tick), it is a Rickshaw Man.
Key Differences
- Long-Legged Doji's open/close can be anywhere within the range
- Rickshaw Man's open/close must be at the exact center of the range
Neutral High Wave
7500% similarCheck if there is a visible body. No body with centered position = Rickshaw Man. Small body = High Wave.
Key Differences
- High Wave has a small visible body
- Rickshaw Man has a doji body (no body)
The Doji is the quintessential indecision candle where opening and closing prices are virtually identical, reflecting a perfect tug-of-war between buyers and sellers.
The High Wave candle features a small body with extremely long upper and lower shadows, signaling intense intraday volatility and extreme indecision that often precedes a significant directional move.
The Long-Legged Doji features extremely long shadows in both directions with the open and close near the center, representing the most extreme form of single-candle indecision and a potent warning of momentum exhaustion.
The Spinning Top is one of the most common candlestick patterns, featuring a small real body with shadows on both sides, indicating mild to moderate indecision where neither buyers nor sellers gained meaningful ground.
The Bearish Belt Hold is a single bearish candle that opens at its high and closes near its low with a long body, indicating that sellers dominated from the opening bell and controlled price action throughout the session.
The Bearish Closing Marubozu is a single bearish candle with no lower shadow — the close is at the exact low of the session. This indicates that sellers controlled the session and maintained pressure through the very last trade, a sign of strong bearish conviction.
Pro Tips & Common Mistakes
Pro Tips
- The Rickshaw Man's mathematical perfection makes it rarer but more significant than an ordinary long-legged doji
- The midpoint (open/close level) becomes a key reference for future support/resistance
- Volume analysis is critical — symmetric volume confirms the balance; asymmetric volume provides direction clues
- After extended trends, the Rickshaw Man is the strongest single-candle exhaustion signal
- Use the shadow extremes as bracket order triggers for the breakout trade
Common Mistakes
- Conflating the Rickshaw Man with any long-legged doji — the centering requirement is key
- Trading the pattern in choppy markets where it confirms indecision rather than predicting a move
- Ignoring the wide stop required by the long shadows when calculating position size
- Not waiting for confirmation from the next candle
- Overanalyzing the perfect symmetry — in practice, near-perfect centering counts
Advanced Techniques
- Use the Rickshaw Man as a volatility trigger — the symmetric range often sets up the next major move's magnitude
- Combine with delta analysis to detect any hidden asymmetry in the buying/selling that is not visible on the candle
- Track the midpoint of the Rickshaw Man as a 'gravity' level that price tends to revisit
- In options, the Rickshaw Man's range provides an excellent guide for straddle/strangle strike selection
Institutional Perspective
Institutional traders view the Rickshaw Man as a 'market test' where both sides explored their range and found equilibrium. The session's data (volume at each extreme, order flow patterns) is invaluable for positioning. Institutions often trigger the breakout after analyzing the Rickshaw Man's internal dynamics.
Fun Facts
- The Rickshaw Man is named after Japanese rickshaw pullers who exert equal force forward and backward while balancing their carriage.
- A mathematically perfect Rickshaw Man (exact center) is one of the rarest single-candle patterns in liquid markets.
- Some quantitative analysts use the Rickshaw Man as a 'zero bias' benchmark for calibrating their directional models.
Frequently Asked Questions
The Rickshaw Man is a long-legged doji where the open and close are at the exact midpoint of the high-low range, creating perfectly symmetrical shadows. It represents the purest form of market equilibrium.
The Rickshaw Man is a subtype of the Long-Legged Doji. The key difference is that the Rickshaw Man's open/close must be at the exact center of the range, while a Long-Legged Doji's open/close can be anywhere.
It is perfectly neutral — the equal shadows show no directional bias whatsoever. The direction is determined entirely by what follows and the broader context.