Overview
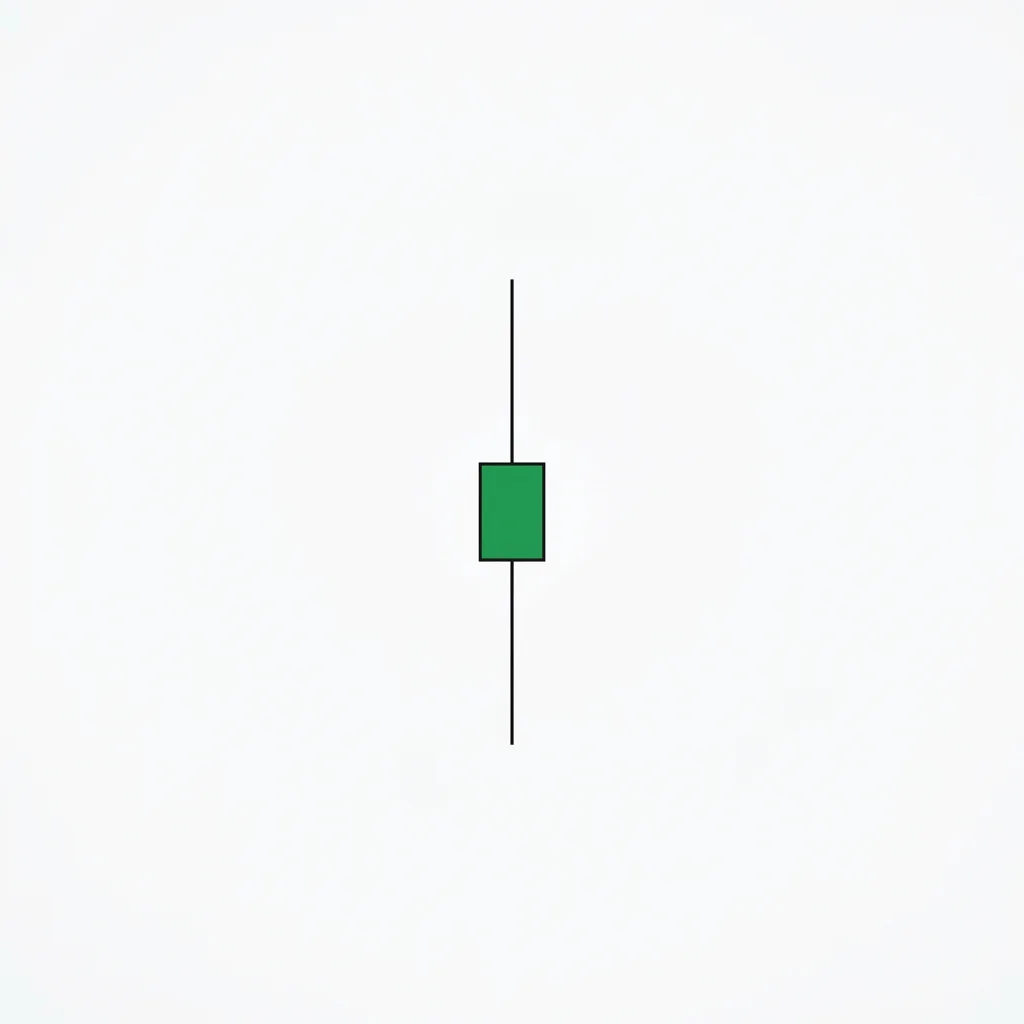
Spinning Top
Koma (独楽)
Also known as: Spinning Top Candle, Koma, Small Body Candle
The Spinning Top is one of the most common candlestick patterns, featuring a small real body with shadows on both sides, indicating mild to moderate indecision where neither buyers nor sellers gained meaningful ground.
The Spinning Top is characterized by a small real body positioned between upper and lower shadows. Unlike a doji, the spinning top has a visible body, but it is small relative to the total range. The pattern shows that price explored both higher and lower levels during the session but closed near the open. This moderate level of indecision is less dramatic than a doji or high-wave candle but still signals that the prevailing trend force is weakening. Spinning tops are extremely common and are most useful as context clues rather than standalone trade signals. After extended trends, a series of spinning tops can signal the transition from trending to ranging conditions.
History & Etymology
The Spinning Top (Koma) is one of the foundational patterns in Japanese candlestick analysis, named after the traditional spinning top toy. The imagery of a toy spinning in place — moving rapidly but going nowhere — captures the candle's essence perfectly.
'Koma' means spinning top in Japanese, referring to the traditional toy that spins rapidly on its axis while remaining in the same position. The candle's small body with symmetric shadows resembles the toy's profile.
How It Forms
Formation Steps
- 1Single candle with a small real body (can be bullish or bearish)
- 2Upper shadow extending above the body
- 3Lower shadow extending below the body
- 4Shadows are at least as long as the body
Prerequisites
- Small real body relative to the total candle range
- Both upper and lower shadows present
- Can appear in any trend context
Confirmation Signals
- Decisive directional candle on the following session
- Volume increase on the next candle
- Break of the spinning top's high or low
Invalidation Signals
- More indecision candles with no resolution
- Price stays within the spinning top range
- Volume continues declining
Candle Breakdown
Spinning Top Candle
A candle with a small real body and moderate shadows on both sides, showing the session ended near where it opened despite some exploration
The market moved in both directions during the session but lacked conviction in either. The small body shows that the net result of all trading activity was minimal price change.
Psychology
The Spinning Top reflects mild indecision — a step below the extreme indecision of doji or high-wave candles. Both buyers and sellers were active during the session, but neither side gained enough control to produce a meaningful directional close. This suggests weakening conviction in the prevailing trend.
Buyer Perspective
Buyers pushed price higher during the session but could not maintain gains. The small body shows their effort produced minimal results, suggesting weakening demand.
Seller Perspective
Sellers pushed price lower during the session but could not sustain the decline. The small body shows limited downside follow-through, suggesting weakening supply pressure.
Smart Money Action
Institutional traders view spinning tops as transitional candles. A sequence of spinning tops after a trend suggests the smart money is transitioning from directional to range-based strategies.
Retail Trader Trap
Retail traders often ignore spinning tops because they seem insignificant. However, a cluster of spinning tops after a trend is a warning that many fail to heed before a reversal.
Emotional Cycle
Trading Strategy
Aggressive Entry
Not recommended as a standalone entry signal — the spinning top is too common and unreliable alone.
Conservative Entry
Use spinning tops as contextual signals to tighten stops or prepare for a potential trend change. Trade only with additional confirmation.
Next significant support or resistance level.
1.5:1 risk-reward ratio.
2:1 risk-reward or the next major technical level.
Best Conditions
- Timeframe: daily
- Timeframe: 4h
- Timeframe: weekly
- after extended trends (as an early warning)
- at support/resistance levels
- before major events
- Asset: stocks
- Asset: forex
- Asset: indices
Avoid When
- Timeframe: 1m
- Timeframe: 5m
- Timeframe: 15m
- range-bound markets where spinning tops are noise
- low-volatility drift
Confluence Factors
- Spinning top appears after an extended trend
- RSI is at an extreme level
- The candle forms at a key technical level
- Multiple spinning tops cluster together
- Volume is declining
Scale In Strategy
Not applicable as a standalone pattern. Use within broader strategy context.
Scale Out Strategy
Use spinning tops as signals to begin scaling out of existing positions.
Risk Management
Volume Analysis
Volume Confirmation
Below-average volume on the spinning top confirms the lack of conviction. Volume must increase on the next candle for any directional signal.
Volume Profile
Normal distribution of volume with no significant concentration at any level.
Volume Divergence
Declining volume during a trend culminating in a spinning top strengthens the exhaustion thesis.
Technical Confluence
Support Resistance
Spinning tops at key support or resistance gain significance as potential reaction signals.
Fibonacci Levels
At Fibonacci levels, spinning tops confirm the market is aware of the level but undecided about direction.
Moving Averages
Spinning tops near major moving averages suggest the market is testing trend definition.
Rsi Confirmation
RSI at extremes with a spinning top increases the probability of a trend pause or reversal.
Macd Confirmation
MACD histogram shrinking toward zero during spinning top sessions confirms weakening momentum.
Bollinger Bands
Spinning tops after a Bollinger Band walk (consecutive touches of one band) signal the walk may be ending.
Vwap
Spinning top near VWAP confirms the session closed near fair value — no directional edge.
Ichimoku Cloud
Spinning tops near Ichimoku signal lines suggest the trend is losing momentum.
Elliott Wave
Spinning tops commonly appear in the latter portions of impulse waves as momentum wanes.
Wyckoff Phase
Sequences of spinning tops can indicate the Automatic Reaction or Secondary Test phases.
Market Profile
Spinning top sessions create balanced market profiles with no extreme extensions.
Order Flow
Balanced order flow with low aggression on both sides confirms the indecision.
Open Interest
Flat open interest during spinning top sessions suggests no new positioning.
Multi-Timeframe Analysis
Higher Timeframe Alignment
Spinning tops on higher timeframes (weekly) carry more significance than on daily or intraday.
Lower Timeframe Entry
After a daily spinning top at a key level, use lower timeframes for direction confirmation.
Timeframe Confluence
Spinning tops across multiple timeframes confirm systemic indecision.
Top-Down Approach
Use spinning tops as context within the broader multi-timeframe analysis framework.
Statistics
Historical Examples
S&P 500 Spinning Top Sequence
successSPX printed three consecutive spinning tops near 4,300 after a strong rally. The sequence preceded a reversal that took the index back below 3,700.
Lesson: Multiple spinning tops in sequence are far more significant than a single occurrence.
EUR/USD Isolated Spinning Top
failureEUR/USD formed a single spinning top at 1.0980. The market continued its trend the next day with no reaction.
Lesson: Isolated spinning tops in the middle of trends are usually noise and do not warrant action.
Bitcoin Spinning Top at Support
successBTC formed a spinning top at the $25,000 support level. The next candle confirmed a bounce with a strong bullish close.
Lesson: Spinning tops at major support or resistance levels are more meaningful than those in open space.
Variations
Bullish Spinning Top
A spinning top with a small bullish (green) body, giving a marginal upward lean.
Bearish Spinning Top
A spinning top with a small bearish (red) body, giving a marginal downward lean.
Confusion Matrix
Patterns commonly confused with Spinning Top and how to distinguish them.
Neutral Doji
8000% similarIf there is a discernible real body, it is a Spinning Top. If the open and close are identical, it is a Doji.
Key Differences
- Doji has virtually no real body
- Spinning Top has a small but visible real body
Neutral High Wave
7000% similarCompare shadow lengths to the average range. If shadows are exceptionally long, it is a High Wave.
Key Differences
- High Wave has disproportionately long shadows
- Spinning Top has moderate, proportional shadows
The Doji is the quintessential indecision candle where opening and closing prices are virtually identical, reflecting a perfect tug-of-war between buyers and sellers.
The High Wave candle features a small body with extremely long upper and lower shadows, signaling intense intraday volatility and extreme indecision that often precedes a significant directional move.
The Bearish Belt Hold is a single bearish candle that opens at its high and closes near its low with a long body, indicating that sellers dominated from the opening bell and controlled price action throughout the session.
The Bearish Closing Marubozu is a single bearish candle with no lower shadow — the close is at the exact low of the session. This indicates that sellers controlled the session and maintained pressure through the very last trade, a sign of strong bearish conviction.
The gravestone doji is a single-candle reversal pattern with the open, close, and low at the same level and a long upper shadow, resembling a gravestone. It signals that buyers pushed price higher but sellers reclaimed all gains by the close.
The hanging man is a single-candle bearish reversal pattern with a small body at the top and a long lower shadow, appearing at the top of an uptrend. It warns that selling pressure is emerging despite the continued uptrend.
Pro Tips & Common Mistakes
Pro Tips
- A single spinning top is rarely actionable — look for clusters or sequences for meaningful signals
- Use spinning tops as supporting evidence within a broader analysis, not as primary trade signals
- After a strong trend, three or more spinning tops signal the transition from trending to ranging conditions
- The color of the body provides a very minor directional lean but is not significant
- Spinning tops at key levels (support, resistance, moving averages) gain significance from the level, not the candle
Common Mistakes
- Treating every spinning top as a reversal signal
- Ignoring spinning tops entirely — they provide useful context when clustered or at key levels
- Overtrading spinning top signals without additional confluence
- Confusing spinning tops with doji — the distinction matters for pattern recognition
- Expecting large moves from spinning top signals alone
Advanced Techniques
- Use spinning top frequency as a regime indicator — frequent spinning tops signal transitioning from trending to ranging markets
- Track the ratio of spinning tops to marubozu candles as a market momentum indicator
- Combine spinning top clusters with Bollinger Band width for compression breakout identification
- Use spinning tops in automated trading systems as a filter to reduce false signals in trend-following strategies
Institutional Perspective
Institutional traders view spinning tops as transitional candles that signal the market is moving from one phase to another. A sequence of spinning tops often coincides with institutional position adjustment, where large players are rotating from directional to range-based strategies.
Fun Facts
- The Spinning Top is the most frequently occurring indecision pattern, appearing in roughly 15-20% of all daily candles.
- Named after the traditional Japanese 'koma' toy that spins rapidly on its axis while remaining in the same spot.
- In quantitative analysis, spinning tops are often used as a volatility filter rather than a directional signal.
Frequently Asked Questions
A Spinning Top is a candle with a small real body and shadows on both sides, indicating mild indecision where neither buyers nor sellers gained meaningful ground during the session.
A Spinning Top has a small but visible real body. A Doji has no real body (open equals close). Both signal indecision, but the Doji is a stronger signal.
Rarely as standalone signals. They are most useful as contextual clues — clusters at key levels or after extended trends. Use them to support other analysis, not as primary signals.