Overview
Long-Legged Doji
Juji (十字)
Also known as: Long-Legged Cross, Rickshaw Man Variant, Extended Doji
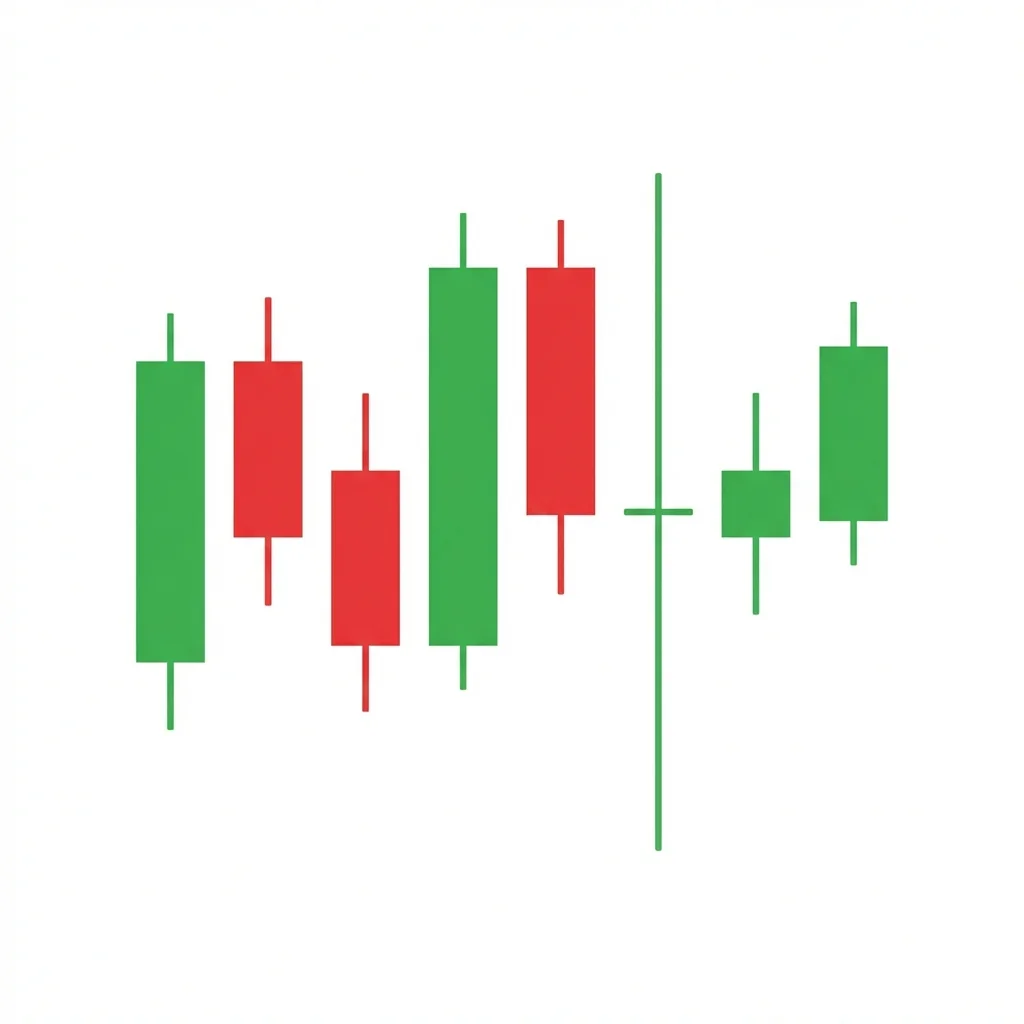
The Long-Legged Doji features extremely long shadows in both directions with the open and close near the center, representing the most extreme form of single-candle indecision and a potent warning of momentum exhaustion.
The Long-Legged Doji is an enhanced version of the standard doji, distinguished by its exceptionally long upper and lower shadows. The candle shows that price traveled far in both directions during the session but ultimately returned to the opening price. The long shadows indicate extreme volatility and aggressive participation from both buyers and sellers, yet neither side could secure an advantage. When appearing after an extended trend, the Long-Legged Doji is one of the most powerful single-candle reversal warnings in candlestick analysis. The extreme price exploration followed by a return to equilibrium suggests that the trend's momentum is exhausted.
History & Etymology
The Long-Legged Doji, known as 'Juji' (cross) in Japanese, was a key pattern in Munehisa Homma's trading system. Homma considered days of extreme indecision following strong trends as critical turning points in market psychology.
Named for its visual appearance — 'long legs' refer to the extended shadows, and 'doji' indicates the equal open and close. The Japanese 'Juji' means cross, describing the pattern's shape.
How It Forms
Formation Steps
- 1Single candle where open and close are at or very near the same price
- 2Very long upper shadow extending well above the open/close
- 3Very long lower shadow extending well below the open/close
Prerequisites
- Open and close must be virtually identical (doji body)
- Both upper and lower shadows must be significantly longer than average candle ranges
- The open/close level should be near the middle of the total range
Confirmation Signals
- A decisive directional candle on the following session
- Volume increase on the confirmation candle
- Break of the doji's high or low with momentum
Invalidation Signals
- Another indecision candle with no resolution
- Price remains within the doji's range for multiple sessions
- Declining volume with no directional commitment
Candle Breakdown
Long-Legged Doji Candle
A doji with extremely long shadows in both directions, showing massive intraday price exploration that resolved at the opening price
The session was a battlefield. Bulls drove price to extreme highs and bears drove it to extreme lows, but the session closed exactly where it opened. The extreme range followed by zero net change reflects total market confusion and emotional exhaustion.
Psychology
The Long-Legged Doji represents the peak of market indecision. The extreme shadows show that both buyers and sellers were highly aggressive during the session, creating massive volatility. Yet the return to the open shows that all this energy produced no directional progress — the ultimate stalemate.
Buyer Perspective
Buyers pushed price to significant highs but could not hold them. While they may be encouraged by the demand shown at the lows, the inability to close higher raises concerns about upside sustainability.
Seller Perspective
Sellers pushed price to significant lows but could not maintain the decline. The strong recovery from lows is concerning, but the failure to close lower shows buyers are not in full control either.
Smart Money Action
Institutional traders use the extreme range to execute large orders — buying at the lows and selling at the highs. The long-legged doji often reflects institutional activity on both sides of the market, creating a natural boundary.
Retail Trader Trap
Retail traders get whipsawed buying the highs and selling the lows during the session. The emotional toll leads to poor decision-making on subsequent sessions.
Emotional Cycle
Trading Strategy
Aggressive Entry
Enter in the expected direction at the close of the doji, with the stop at the opposite shadow extreme.
Conservative Entry
Wait for the next candle to close decisively above the high or below the low of the doji.
1:1 risk-reward (significant given the wide range).
Next major support or resistance level.
Measured move equal to the full doji range projected from the breakout.
Best Conditions
- Timeframe: daily
- Timeframe: weekly
- Timeframe: 4h
- after extended trends
- at major support/resistance levels
- at all-time highs or lows
- Asset: stocks
- Asset: forex
- Asset: crypto
- Asset: commodities
Avoid When
- Timeframe: 1m
- Timeframe: 5m
- Timeframe: 15m
- choppy markets
- low-volatility environments
- range-bound trading
Confluence Factors
- Appears at a major support or resistance level
- RSI is at an extreme reading (overbought or oversold)
- Volume is significantly above average
- Bollinger Bands are at maximum width
- Major Fibonacci level alignment
Scale In Strategy
Enter small at the doji close, add on confirmation candle close in the expected direction.
Scale Out Strategy
Exit half at 1:1 R:R, trail the remainder with a wide stop.
Risk Management
Volume Analysis
Volume Confirmation
High volume on the long-legged doji confirms genuine bilateral activity. Volume surge on the breakout candle validates direction.
Volume Profile
Heavy volume at both shadow extremes indicates true institutional participation at those levels.
Volume Divergence
Declining volume leading into a high-volume long-legged doji is a classic exhaustion signal.
Technical Confluence
Support Resistance
Long-legged doji at major support/resistance creates the most powerful indecision signal. The shadow extremes become key reference levels.
Fibonacci Levels
Doji at a Fibonacci confluence with shadows testing multiple retracement levels shows the market actively exploring the Fibonacci framework.
Moving Averages
Long-legged doji at a major MA (50 or 200 day) signals the market is violently testing the trend-defining level.
Rsi Confirmation
RSI at extremes during a long-legged doji increases the probability of a reversal on the next session.
Macd Confirmation
MACD histogram flippping during the session, ending near zero, confirms the bilateral battle and exhaustion.
Bollinger Bands
Shadows touching or exceeding both Bollinger Bands creates a maximum volatility expansion event.
Vwap
Price crossing VWAP multiple times during the session before closing near it confirms the indecision and equilibrium.
Ichimoku Cloud
Long-legged doji spanning the entire Kumo cloud indicates maximum indecision at the cloud boundary.
Elliott Wave
Frequently marks the termination point of Wave 5 or the extreme of Wave B before a reversal.
Wyckoff Phase
Can represent the Selling Climax or Buying Climax in Wyckoff methodology.
Market Profile
Creates a wide, single-distribution profile, indicating rejection of both extreme prices.
Order Flow
Massive delta swings with net delta near zero confirm the bilateral aggression and exhaustion.
Open Interest
Significant open interest changes indicate major position restructuring during the session.
Multi-Timeframe Analysis
Higher Timeframe Alignment
A daily long-legged doji at a weekly key level is a high-impact signal that can define the next multi-week move.
Lower Timeframe Entry
After a daily long-legged doji, use the 1-hour chart to enter on the breakout of the doji's range.
Timeframe Confluence
Long-legged doji on both daily and 4-hour charts at the same level dramatically increases reversal probability.
Top-Down Approach
Weekly trend provides macro context. Daily long-legged doji marks the inflection. 4-hour chart provides the entry.
Statistics
Historical Examples
Nasdaq Long-Legged Doji at Top
successQQQ printed a weekly long-legged doji near all-time highs. The following weeks saw a significant correction of over 20%.
Lesson: Weekly long-legged doji at all-time highs are among the most reliable exhaustion signals.
USD/JPY Long-Legged Doji Reversal
successUSD/JPY formed a long-legged doji at 151.95 before the Bank of Japan intervention. Price reversed sharply, declining several hundred pips.
Lesson: Long-legged doji at extreme price levels can precede intervention-driven or event-driven reversals.
Ethereum Mid-Range Long-Legged Doji
failureETH formed a long-legged doji at $1,750 in the middle of its range. Price continued sideways for two weeks with no directional resolution.
Lesson: Long-legged doji in the middle of ranges lack significance. Context at trend extremes is essential.
Variations
Asymmetric Long-Legged Doji
A long-legged doji where one shadow is longer than the other, providing a slight directional bias.
Rickshaw Man
A perfect long-legged doji where the open and close are exactly at the midpoint of the high-low range.
Confusion Matrix
Patterns commonly confused with Long-Legged Doji and how to distinguish them.
Neutral High Wave
8500% similarCheck if the open and close are identical. No body = Long-Legged Doji. Small body = High Wave.
Key Differences
- High Wave has a small but visible real body
- Long-Legged Doji has no real body (open equals close)
Neutral Rickshaw Man
9000% similarMeasure whether the open/close is at the exact center of the shadow range. If precisely centered, it is a Rickshaw Man.
Key Differences
- Rickshaw Man has the open/close exactly at the midpoint of the range
- Long-Legged Doji's open/close can be near but not necessarily at the exact midpoint
The Doji is the quintessential indecision candle where opening and closing prices are virtually identical, reflecting a perfect tug-of-war between buyers and sellers.
The High Wave candle features a small body with extremely long upper and lower shadows, signaling intense intraday volatility and extreme indecision that often precedes a significant directional move.
The Rickshaw Man is a specialized long-legged doji where the open and close are positioned exactly at the midpoint of the candle's range, representing the purest expression of market indecision with perfectly balanced shadows.
The Spinning Top is one of the most common candlestick patterns, featuring a small real body with shadows on both sides, indicating mild to moderate indecision where neither buyers nor sellers gained meaningful ground.
The Bearish Belt Hold is a single bearish candle that opens at its high and closes near its low with a long body, indicating that sellers dominated from the opening bell and controlled price action throughout the session.
The Bearish Closing Marubozu is a single bearish candle with no lower shadow — the close is at the exact low of the session. This indicates that sellers controlled the session and maintained pressure through the very last trade, a sign of strong bearish conviction.
Pro Tips & Common Mistakes
Pro Tips
- The Long-Legged Doji is most powerful at the end of extended trends and at all-time highs or lows
- Compare the shadow length to the Average True Range — shadows exceeding 2x ATR increase significance
- High volume on the long-legged doji session is critical — low volume diminishes the signal
- Use the shadow extremes as key support and resistance levels for future trade planning
- A long-legged doji on the weekly chart is a rare and extremely significant event
Common Mistakes
- Trading every long-legged doji regardless of its position within the price structure
- Failing to adjust position size for the wide stop required by the extended shadows
- Entering without confirmation on the next candle
- Confusing news-driven volatile candles with genuine long-legged doji reversal signals
- Ignoring the context of the overall trend and market conditions
Advanced Techniques
- Use the shadow extremes as a breakout range — bracket orders above and below capture the directional move
- Combine with volume at price analysis to determine which shadow extreme attracted more institutional buying/selling
- On lower timeframes, the long-legged doji typically appears as a double rejection (V-top and V-bottom within the same session)
- Use the doji's range as a volatility gauge for options pricing — implied volatility often expands significantly after this pattern
Institutional Perspective
The Long-Legged Doji represents a session where institutional players were actively testing both sides of the market. The extreme shadows often reflect stop hunts designed to create liquidity. Institutions use the information gathered during these tests to position for the subsequent directional move.
Fun Facts
- The Long-Legged Doji has the highest ratio of intraday range to net price change of any candlestick pattern.
- In Japanese trading tradition, the Long-Legged Doji was called 'the market's confusion' and traders were advised to step aside until clarity returned.
- A weekly Long-Legged Doji on the S&P 500 has preceded four of the last six major market corrections.
Frequently Asked Questions
A Long-Legged Doji is a single candle with no real body (open equals close) and very long upper and lower shadows, indicating extreme intraday volatility where neither buyers nor sellers could gain control.
The Long-Legged Doji has much longer shadows than a standard Doji, reflecting significantly more intraday volatility and a more extreme state of indecision.
It is most reliable at the end of extended trends, at all-time highs or lows, and at major support/resistance levels. High volume increases its significance.