Overview
Doji Cluster
Also known as: Multiple Doji, Doji Sequence, Consecutive Doji
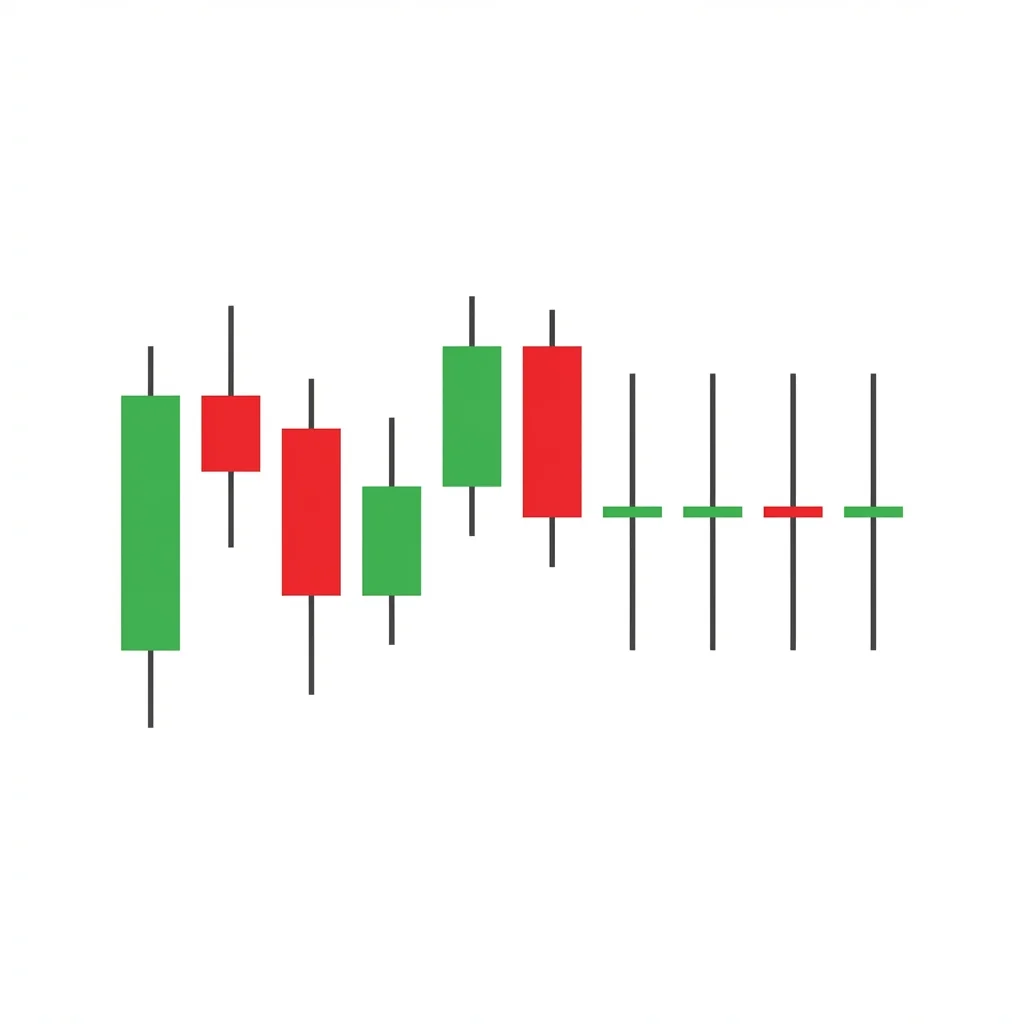
A Doji Cluster consists of two or more consecutive doji candles, indicating prolonged indecision and compressed volatility that typically precedes a significant breakout move.
The Doji Cluster forms when the market prints multiple consecutive doji candles, each showing that buyers and sellers remain in equilibrium session after session. This sustained indecision creates a coiled-spring effect where energy builds up for an eventual explosive move. The cluster acts as a volatility compression zone, and the longer it persists, the more powerful the eventual breakout tends to be. Traders watch for the first decisive candle out of the cluster to signal the new direction. The pattern is more significant when it appears after a clear trend, as it often signals the trend is either pausing for continuation or preparing to reverse.
History & Etymology
The concept of clustering doji candles was recognized in traditional Japanese charting as a sign that the market was 'resting' before its next major move. Modern technical analysts have formalized the cluster as a volatility contraction pattern similar to Bollinger Band squeezes.
The name combines 'doji' (Japanese for 'the same thing') with 'cluster' to describe a grouping of these indecision candles in sequence.
How It Forms
Formation Steps
- 1Two or more consecutive doji candles forming a tight cluster
- 2Each candle has a negligible real body with varying shadow lengths
- 3The cluster occupies a narrow price range
Prerequisites
- At least two consecutive doji or near-doji candles
- Candles should form within a relatively tight price range
- Typically appears after a directional move
Confirmation Signals
- A strong directional candle breaking out of the cluster range
- Volume spike on the breakout candle
- Gap away from the cluster in either direction
Invalidation Signals
- Gradual drift without a decisive breakout
- Volume continues to decline with no resolution
- Price remains range-bound with no expansion
Candle Breakdown
First Doji
The initial doji candle that marks the beginning of the indecision period
The first doji after a trend alerts traders that momentum is fading and the market is entering a decision phase.
Second Doji
A follow-up doji confirming that indecision persists and neither side can gain control
Consecutive indecision increases tension. Both buyers and sellers are waiting for a catalyst.
Third Doji (Optional)
Additional doji candles further compress volatility and build energy for the eventual breakout
Extended indecision creates a pressure cooker effect. The longer the cluster, the more violent the eventual breakout.
Psychology
The Doji Cluster represents a prolonged standoff between buyers and sellers. Each consecutive doji amplifies the uncertainty, creating mounting tension that must eventually resolve with a decisive move. The pattern reflects accumulation or distribution occurring beneath the surface.
Buyer Perspective
Buyers see the stalled price action as a potential base-building phase. They accumulate positions gradually during the cluster, expecting an upside breakout, but remain cautious until confirmation.
Seller Perspective
Sellers interpret the inability to continue a decline as a warning. They may distribute positions during the cluster or prepare to short aggressively if the cluster breaks to the downside.
Smart Money Action
Institutional traders use doji clusters to quietly build large positions. The low volatility allows them to accumulate or distribute without moving the market significantly. They are often the catalyst for the eventual breakout.
Retail Trader Trap
Retail traders become impatient during the cluster and either exit positions prematurely or attempt to predict the breakout direction, often getting whipsawed.
Emotional Cycle
Trading Strategy
Aggressive Entry
Enter on the first candle that closes decisively beyond the cluster's high or low range with increased volume.
Conservative Entry
Wait for a close beyond the cluster range followed by a retest of the breakout level that holds.
Measured move equal to the height of the prior trend leg before the cluster.
Next major support or resistance level.
2x the measured move of the prior trend leg.
Best Conditions
- Timeframe: daily
- Timeframe: 4h
- Timeframe: weekly
- after trending moves
- before earnings or events
- at major technical levels
- Asset: stocks
- Asset: forex
- Asset: crypto
Avoid When
- Timeframe: 1m
- Timeframe: 5m
- extended sideways markets
- holiday trading
- low liquidity periods
Confluence Factors
- Cluster forms at a key support or resistance level
- Bollinger Bands are squeezing simultaneously
- ATR is at multi-period lows
- Volume is declining during the cluster
- Major moving average convergence at the cluster level
Scale In Strategy
Enter half position on the initial breakout, add the remainder on a successful pullback retest of the cluster range.
Scale Out Strategy
Take one-third profit at TP1, one-third at TP2, and trail the final third.
Risk Management
Volume Analysis
Volume Confirmation
Volume should decrease during the cluster and surge on the breakout candle for highest probability.
Volume Profile
Declining volume during the cluster with a dramatic increase on breakout is the ideal volume signature.
Volume Divergence
If volume increases during the cluster without a breakout, it may indicate stealth accumulation or distribution.
Technical Confluence
Support Resistance
Doji clusters at major support or resistance create high-probability breakout zones. The direction of the break often leads to a sustained move.
Fibonacci Levels
Clusters forming at Fibonacci confluence zones (38.2%, 50%, 61.8%) suggest the market is coiling at a significant level.
Moving Averages
A doji cluster at the convergence of the 50 and 200 EMA is an especially powerful setup for a major move.
Rsi Confirmation
RSI flattening near 50 during a doji cluster confirms the indecision; a break above 60 or below 40 signals direction.
Macd Confirmation
MACD histogram bars shrinking toward zero during the cluster, followed by expansion, confirms the breakout.
Bollinger Bands
Bollinger Band squeeze occurring simultaneously with a doji cluster creates a double compression signal.
Vwap
Doji cluster near VWAP indicates price discovery at fair value; the breakout direction reveals the next market imbalance.
Ichimoku Cloud
Cluster within the Kumo cloud represents ultimate indecision; breakout above or below the cloud confirms direction.
Elliott Wave
Doji clusters often form during Wave 4 corrections or B waves, representing the market's pause before the final impulse.
Wyckoff Phase
The cluster can represent the Last Point of Support (LPS) or Last Point of Supply (LPSY) before a markup or markdown phase.
Market Profile
Cluster forming at the Point of Control indicates the market is accepting value; a break signals value migration.
Order Flow
Decreasing delta during the cluster with a sudden delta surge on breakout confirms genuine directional conviction.
Open Interest
Rising open interest during a quiet cluster suggests new positions being established ahead of the breakout.
Multi-Timeframe Analysis
Higher Timeframe Alignment
A doji cluster on the daily chart at a weekly support/resistance level is an extremely high-probability setup.
Lower Timeframe Entry
After identifying a daily doji cluster, use the 15-minute or 1-hour chart to enter on the first sign of a breakout from the range.
Timeframe Confluence
Doji clusters appearing on multiple timeframes simultaneously signal a major inflection point.
Top-Down Approach
Weekly trend direction determines breakout bias. Daily doji cluster identifies the setup. 4-hour chart provides the entry trigger.
Statistics
Historical Examples
Tesla Doji Cluster Before Earnings Breakout
successTSLA formed three consecutive doji candles near $125 before earnings. The post-earnings candle broke upward with massive volume, rallying 30% in weeks.
Lesson: Doji clusters before catalytic events can produce exceptional breakout moves.
Gold Cluster at Resistance
failureGold formed a four-doji cluster near $2,050 resistance. Price broke briefly above but quickly reversed, trapping breakout buyers.
Lesson: Always confirm breakouts from doji clusters with volume. False breakouts at major resistance are common.
EUR/USD Weekly Cluster
successEUR/USD printed two weekly doji candles near 1.1000 before breaking higher to 1.1275 over the following weeks.
Lesson: Weekly doji clusters carry more significance and tend to produce larger subsequent moves.
Variations
Two-Doji Cluster
The minimum cluster formation with just two consecutive doji candles.
Extended Doji Cluster
Four or more consecutive doji candles creating extreme compression.
Confusion Matrix
Patterns commonly confused with Doji Cluster and how to distinguish them.
Neutral Tight Coil
7500% similarCheck if the candles have visible real bodies. If they do but ranges are shrinking, it is a Tight Coil. If the bodies are negligible, it is a Doji Cluster.
Key Differences
- Tight Coil includes non-doji candles with decreasing ranges
- Doji Cluster specifically requires doji or near-doji candles
Neutral Volatility Contraction
7000% similarDoji Cluster is a candlestick pattern; Volatility Contraction is an indicator-based observation. They often overlap.
Key Differences
- Volatility Contraction is defined by shrinking ATR/Bollinger Bands
- Doji Cluster is defined by consecutive doji candle formations
The Doji is the quintessential indecision candle where opening and closing prices are virtually identical, reflecting a perfect tug-of-war between buyers and sellers.
The Inside Bar is a two-candle pattern where the second candle's entire range is contained within the first candle, signaling a contraction in volatility and a pending breakout in either direction.
The Squeeze Breakout occurs when volatility compresses to extreme levels (tight Bollinger Bands or low ATR) before an explosive directional move, representing the market's transition from consolidation to trending.
The Tight Coil is a multi-candle pattern where each successive candle has a smaller range than the last, creating a coiled-spring effect that typically precedes an explosive directional breakout.
The Volatility Contraction Pattern (VCP) shows progressively smaller price swings as ATR declines, signaling that the market is absorbing supply and preparing for a significant directional breakout.
The Bearish Breakaway is a five-candle reversal pattern where a gap-up rally stalls over three sessions before a powerful bearish candle breaks back down into the gap, signaling the uptrend is exhausted.
Pro Tips & Common Mistakes
Pro Tips
- The more doji candles in the cluster, the more explosive the eventual breakout tends to be
- Use Bollinger Band Width or ATR to quantify the volatility compression alongside the visual pattern
- Set bracket orders (buy stop above, sell stop below) to capture the breakout in either direction
- Volume declining during the cluster is the key signature — increasing volume during the cluster may indicate a different pattern
- Combine with event calendars to anticipate which catalyst will trigger the breakout
Common Mistakes
- Trying to predict the breakout direction before it occurs
- Entering during the cluster rather than waiting for the breakout
- Using stops that are too tight within the cluster range
- Ignoring false breakouts — always require a close beyond the range, not just an intraday breach
- Failing to recognize that clusters in range-bound markets may not produce tradable breakouts
Advanced Techniques
- Combine doji cluster with Keltner Channel inside Bollinger Band squeeze for the highest probability breakout signals
- Use options straddles or strangles to profit from the volatility expansion without predicting direction
- Monitor order flow for large hidden orders during the cluster that may indicate institutional accumulation
- Apply the cluster range as a future support/resistance zone after the breakout occurs
Institutional Perspective
Institutions actively create doji cluster conditions by absorbing liquidity on both sides of the market. They use the low-volatility environment to fill large orders without slippage, then trigger the breakout once their positions are established.
Fun Facts
- Doji Clusters lasting 4+ days are statistically followed by moves that are 1.5x larger than average single-doji breakouts.
- The longest recorded doji cluster in a major stock index was seven consecutive doji candles on the Nikkei 225 in 1995.
- Algorithmic trading systems specifically scan for doji clusters as volatility breakout setups, making them a favorite of quantitative traders.
Frequently Asked Questions
A Doji Cluster is a pattern of two or more consecutive doji candles that signals prolonged market indecision and typically precedes a significant breakout move.
Wait for a strong candle to close outside the cluster's high-low range with above-average volume. Enter in the breakout direction with a stop on the opposite side of the cluster.
The extended indecision compresses volatility like a coiled spring. When the equilibrium breaks, the built-up energy releases in a powerful directional move.