Overview
Hammer Doji
Tonbo (トンボ)
Also known as: Dragonfly Doji, Tonbo, T-Doji
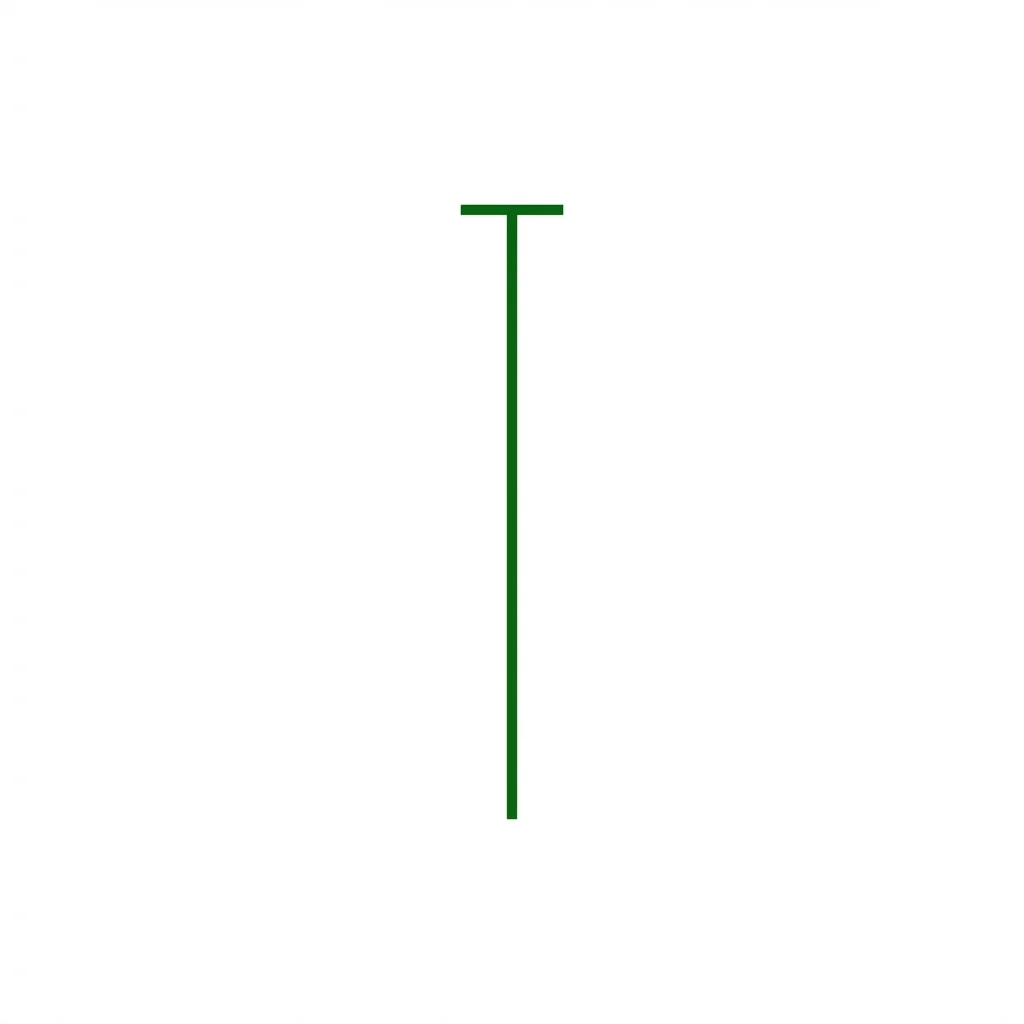
The Hammer Doji (Dragonfly Doji) features a long lower shadow with the open and close at the session high, showing that sellers drove price down sharply but buyers recovered all losses, creating a neutral signal that depends on context.
The Hammer Doji, also known as the Dragonfly Doji, is a single-candle pattern where the open and close are at or near the high of the session, with a long lower shadow. During the session, sellers pushed price significantly lower, but buyers stepped in aggressively to recover all the lost ground. The result is a T-shaped candle that indicates rejection of lower prices. While often associated with bullish reversals when appearing in downtrends, the Hammer Doji is technically neutral because its directional implication depends entirely on context. In an uptrend, it can signal continuation; in a downtrend, it signals potential reversal; at resistance, it may indicate a final push before exhaustion.
History & Etymology
Known as 'Tonbo' (dragonfly) in Japanese, this pattern was one of the key formations identified by Munehisa Homma in his rice trading system. The dragonfly imagery comes from the candle's resemblance to the insect with its body at the top and wings spread below.
The 'hammer doji' name combines the Western 'hammer' description (the shape of a hammer or mallet) with 'doji' (indicating the open and close are equal). The Japanese name 'Tonbo' means dragonfly, describing the visual appearance.
How It Forms
Formation Steps
- 1Single candle with open and close at or near the session high
- 2Long lower shadow at least two to three times the body length
- 3Little to no upper shadow
Prerequisites
- Open and close must be at or very near the same price (doji body)
- Long lower shadow showing significant intraday selling that was fully recovered
- Can appear in uptrends, downtrends, or sideways markets
Confirmation Signals
- Next candle closes above the hammer doji high
- Volume increases on the confirmation candle
- Gap up on the following session
Invalidation Signals
- Next candle closes below the hammer doji low
- No follow-through buying on subsequent candles
- Volume declines after the pattern
Candle Breakdown
Hammer Doji Candle
A candle with no body (doji) at the session high and a long lower shadow showing complete price recovery from intraday lows
Sellers dominated during the session, pushing price sharply lower. However, buyers mounted a complete comeback, recovering every point lost. This tug-of-war ended in a draw at the high, suggesting strong buying interest at lower levels.
Psychology
The Hammer Doji reveals that despite significant selling pressure during the session, buyers were able to fully recover. This creates a narrative of rejection — the market tested lower prices and decidedly rejected them, but the doji body means no clear winner emerged at the close.
Buyer Perspective
Buyers see the complete recovery from lows as evidence of strong demand. They interpret the long lower shadow as a 'test' of support that passed, building confidence for upside positioning.
Seller Perspective
Sellers initially controlled the session but were completely overwhelmed by buyers. The failure to hold lower prices raises doubt about the downside thesis, causing some sellers to cover positions.
Smart Money Action
Institutional traders use the long lower shadow to identify demand zones. They may place large buy orders near the low of the hammer doji's shadow, expecting that level to hold as support in the future.
Retail Trader Trap
Retail traders who sold short during the session's decline are caught in a short squeeze as price recovers. Those who panic-covered at the close contributed to the complete recovery.
Emotional Cycle
Trading Strategy
Aggressive Entry
Enter long at the close of the hammer doji with a stop below the lower shadow.
Conservative Entry
Wait for the next candle to close above the hammer doji's high before entering long.
1:1 risk-reward based on the shadow length.
Next resistance level or previous swing high.
2:1 risk-reward or measured move equal to the full candle range.
Best Conditions
- Timeframe: daily
- Timeframe: 4h
- Timeframe: weekly
- at support levels in downtrends
- oversold conditions
- after capitulation selling
- Asset: stocks
- Asset: forex
- Asset: crypto
- Asset: commodities
Avoid When
- Timeframe: 1m
- Timeframe: 5m
- in the middle of a strong downtrend with no support
- low liquidity
- during bear market crashes
Confluence Factors
- Hammer doji forms at a key support level
- RSI is in oversold territory (below 30)
- The lower shadow touches a major moving average
- Fibonacci retracement level aligns with the doji
- Bullish divergence on MACD or RSI
Scale In Strategy
Enter half at the doji close, add the remainder on confirmation candle close above the high.
Scale Out Strategy
Take one-third profit at TP1, trail the rest with a swing-low trailing stop.
Risk Management
Volume Analysis
Volume Confirmation
High volume on the hammer doji itself is a positive sign, indicating active buying during the recovery. Higher volume on the confirmation candle adds conviction.
Volume Profile
Heavy volume at the lower shadow levels suggests institutional buying. Light volume on the recovery portion is less convincing.
Volume Divergence
Increasing volume on the doji after declining volume during the downtrend supports a reversal thesis.
Technical Confluence
Support Resistance
Most powerful when the lower shadow touches and rejects a major support level, confirming demand at that zone.
Fibonacci Levels
The lower shadow wicking into a 50% or 61.8% Fibonacci level and recovering creates a high-probability long setup.
Moving Averages
The lower shadow kissing the 50 or 200 EMA and recovering is an especially strong signal.
Rsi Confirmation
RSI below 30 with a hammer doji formation produces a high-probability reversal signal.
Macd Confirmation
MACD bullish divergence (price making lower lows while MACD makes higher lows) at the hammer doji confirms momentum shift.
Bollinger Bands
The lower shadow penetrating the lower Bollinger Band and recovering signals a classic mean reversion opportunity.
Vwap
Intraday hammer doji with the shadow testing below VWAP and recovering above suggests institutional buying.
Ichimoku Cloud
Hammer doji bouncing off the Kumo cloud support confirms the cloud as a demand zone.
Elliott Wave
Hammer doji frequently marks the end of Wave 5 or Wave C, signaling the exhaustion of the impulsive or corrective move.
Wyckoff Phase
The long lower shadow can represent a Spring in Wyckoff accumulation, testing below support and recovering.
Market Profile
Lower shadow testing the Value Area Low with a recovery signals responsive buying.
Order Flow
Aggressive buy orders absorbing sell-side liquidity at the shadow lows confirm genuine demand.
Open Interest
Rising open interest with a hammer doji suggests new long positions being established.
Multi-Timeframe Analysis
Higher Timeframe Alignment
A daily hammer doji at a weekly support level provides a high-conviction long setup.
Lower Timeframe Entry
After a daily hammer doji, use the 1-hour chart to enter on a pullback to the doji close level.
Timeframe Confluence
Hammer doji appearing on both the daily and 4-hour chart at the same level confirms strong demand.
Top-Down Approach
Identify weekly support zones, look for daily hammer doji at those levels, and use the 4-hour chart for precise entry timing.
Statistics
Historical Examples
Apple Hammer Doji at 200-Day MA
successAAPL printed a hammer doji with its lower shadow touching the 200-day moving average near $125. The following sessions saw a recovery rally back above $135.
Lesson: Hammer doji at major moving averages provide high-probability long entries, especially in fundamentally sound stocks.
Bitcoin Hammer Doji During Selloff
partialBTC formed a hammer doji at $17,600 during the 2022 crypto crash. Price bounced to $24,000 but eventually resumed the downtrend.
Lesson: Hammer doji in bear markets can produce tradable bounces but may not mark the final bottom.
EUR/USD Failed Hammer Doji
failureEUR/USD formed a hammer doji at 1.0500 but the next candle closed below the doji's low, triggering a continuation of the decline.
Lesson: Always wait for confirmation. A hammer doji without bullish follow-through is just a candle, not a trade.
Variations
Long-Shadow Hammer Doji
A hammer doji where the lower shadow is exceptionally long, at least four times the average candle range.
Near-Hammer Doji
A hammer shape where the body is just barely visible, not quite a true doji but functionally similar.
Confusion Matrix
Patterns commonly confused with Hammer Doji and how to distinguish them.
Bullish Hammer
8500% similarIf there is a visible real body (even small), it is a Hammer. If the open and close are identical, it is a Hammer Doji.
Key Differences
- Bullish Hammer has a small real body; Hammer Doji has no real body
- Bullish Hammer is classified as bullish; Hammer Doji is neutral
Neutral Shooting Star Doji
3000% similarLook at which end has the long shadow. Upper shadow = Shooting Star Doji. Lower shadow = Hammer Doji.
Key Differences
- Shooting Star Doji has a long upper shadow; Hammer Doji has a long lower shadow
- They are mirror images of each other
The Dragonfly Doji is a powerful single-candle reversal signal where sellers push price significantly lower during the session, but buyers fight back to close at the opening level, creating a T-shaped candle that signals complete rejection of lower prices.
The Doji is the quintessential indecision candle where opening and closing prices are virtually identical, reflecting a perfect tug-of-war between buyers and sellers.
The Shooting Star Doji (Gravestone Doji) features a long upper shadow with the open and close at the session low, showing buyers drove prices up but sellers reversed all gains, creating a context-dependent signal that leans bearish in uptrends.
The Bearish Belt Hold is a single bearish candle that opens at its high and closes near its low with a long body, indicating that sellers dominated from the opening bell and controlled price action throughout the session.
The Bearish Closing Marubozu is a single bearish candle with no lower shadow — the close is at the exact low of the session. This indicates that sellers controlled the session and maintained pressure through the very last trade, a sign of strong bearish conviction.
The gravestone doji is a single-candle reversal pattern with the open, close, and low at the same level and a long upper shadow, resembling a gravestone. It signals that buyers pushed price higher but sellers reclaimed all gains by the close.
Pro Tips & Common Mistakes
Pro Tips
- The longer the lower shadow, the more significant the rejection of lower prices
- Volume on the hammer doji matters — high volume indicates genuine buying pressure during the recovery
- In downtrends, the hammer doji is more bullish; in uptrends, it can simply be continuation
- Use the low of the lower shadow as a key support level for future reference
- Multiple hammer doji at the same level create an extremely strong demand zone
Common Mistakes
- Automatically assuming a hammer doji is bullish without checking the trend context
- Ignoring the upper shadow — a small upper shadow is acceptable but a significant one changes the interpretation
- Placing stops inside the lower shadow rather than below it
- Trading hammer doji in choppy, range-bound markets where they lack significance
- Confusing a regular hammer (with a small body) with a hammer doji (no body)
Advanced Techniques
- Use the hammer doji's lower shadow as a demand zone and set limit buy orders there for future pullbacks
- Combine with footprint charts to see if the buying at the shadow lows was aggressive or passive
- On lower timeframes, the hammer doji typically appears as a V-shaped reversal that can be traded for entry refinement
- Use the hammer doji shadow length to calibrate expected volatility for position sizing
Institutional Perspective
Institutional traders often engineer hammer doji candles by placing large buy orders at support levels, absorbing sell-side liquidity and creating the long lower shadow. They use these demand zones to build positions, knowing that the visible rejection will attract additional buyers.
Fun Facts
- The Japanese name 'Tonbo' (dragonfly) comes from the candle's resemblance to a dragonfly with its body at top and wings below.
- In traditional Japanese candlestick theory, the dragonfly doji appearing after a decline was considered one of the most auspicious reversal signals.
- The hammer doji has a mirror twin — the shooting star doji (gravestone doji) — which looks like an inverted T.
Frequently Asked Questions
A Hammer Doji is a single candle with no real body (open equals close) at the top and a long lower shadow, indicating that sellers pushed price down during the session but buyers recovered all losses.
It is technically neutral and depends on context. In a downtrend at support, it leans bullish. In an uptrend, it may signal continuation. Always wait for confirmation.
A regular Hammer has a small real body, while a Hammer Doji has no real body (open and close are the same). The Hammer Doji shows more indecision at the close.