Overview
Shooting Star Doji
Tohba (塔婆)
Also known as: Gravestone Doji, Tohba, Inverted T Doji
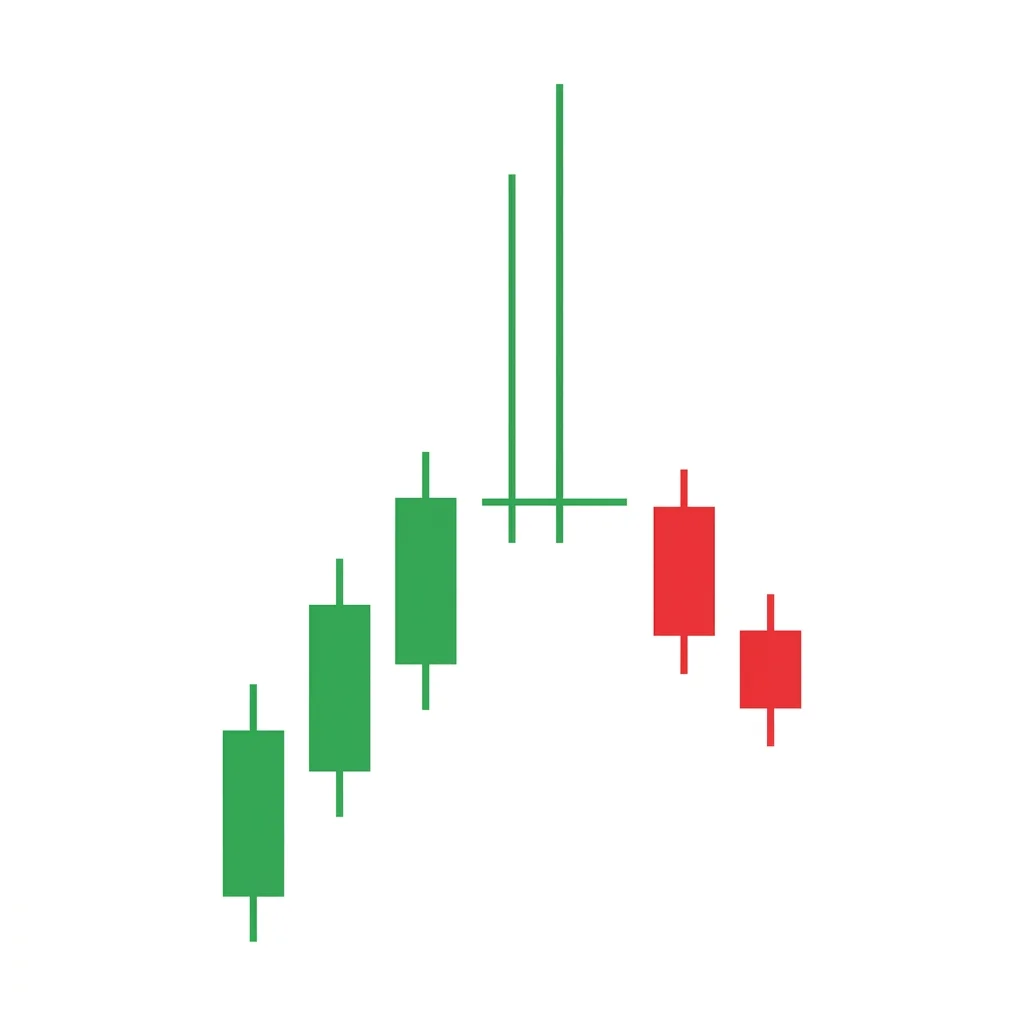
The Shooting Star Doji (Gravestone Doji) features a long upper shadow with the open and close at the session low, showing buyers drove prices up but sellers reversed all gains, creating a context-dependent signal that leans bearish in uptrends.
The Shooting Star Doji, also known as the Gravestone Doji, is the mirror image of the Hammer Doji. It forms when the open and close are at or near the low of the session, with a long upper shadow extending above. During the session, buyers pushed price significantly higher, but sellers overwhelmed them and drove price back to the opening level. The resulting inverted-T shape shows rejection of higher prices. While the pattern is technically neutral without context, it carries a bearish lean because the inability to hold gains suggests upside resistance. In uptrends, this pattern is a strong reversal warning. At support in downtrends, it can occasionally signal a final push before continuation lower.
History & Etymology
Known as 'Tohba' (tombstone or stupa) in Japanese candlestick tradition, this pattern was associated with graveyards and endings. The gravestone imagery reflects the idea that the day's rally is 'buried' by the close, symbolizing the death of upward momentum.
The 'Gravestone Doji' name comes from the candle's resemblance to a gravestone standing upright. The Japanese 'Tohba' refers to a Buddhist stupa or memorial tower. 'Shooting Star Doji' combines the Western shooting star concept with the doji classification.
How It Forms
Formation Steps
- 1Single candle with open and close at or near the session low
- 2Long upper shadow extending well above the open/close
- 3Little to no lower shadow
Prerequisites
- Open and close must be at or very near the same price (doji body)
- Long upper shadow showing significant intraday rally that was fully reversed
- Can appear in any trend context
Confirmation Signals
- Next candle closes below the shooting star doji's low
- Volume increases on the bearish follow-through candle
- Gap down on the following session
Invalidation Signals
- Next candle closes above the shooting star doji's high
- Bullish continuation with higher highs
- Volume declines with no follow-through
Candle Breakdown
Shooting Star Doji Candle
A doji candle at the session low with a long upper shadow, showing a complete reversal of intraday gains
Buyers pushed price sharply higher during the session, signaling strong demand. However, sellers overpowered them completely, reversing all gains. This total reversal within a single session is a powerful rejection of higher prices.
Psychology
The Shooting Star Doji shows that despite strong buying during the session, sellers were able to completely reverse the gains. The long upper shadow represents rejected buying enthusiasm, and the close at the low shows sellers had the final word. This creates a narrative of supply overwhelming demand at higher prices.
Buyer Perspective
Buyers pushed price to significant highs but could not hold any gains. The complete reversal is demoralizing and suggests strong resistance above. Some buyers will exit, adding to selling pressure on subsequent sessions.
Seller Perspective
Sellers see the complete reversal from highs as confirmation of their bearish thesis. The long upper shadow shows exactly where supply exists, providing a reference for resistance and stop placement.
Smart Money Action
Institutional traders use the rally phase to distribute (sell) at higher prices. The long upper shadow often reflects institutional selling that retail buyers were unable to absorb. The close at the low confirms the distribution.
Retail Trader Trap
Retail traders who bought during the session's rally are trapped when all gains evaporate. Those who held through the reversal face the decision to hold at a loss or cut their position.
Emotional Cycle
Trading Strategy
Aggressive Entry
Short at the close of the Shooting Star Doji with a stop above the upper shadow.
Conservative Entry
Wait for a bearish candle closing below the doji's low on the next session before shorting.
1:1 risk-reward based on the shadow length.
Next significant support level or previous swing low.
2:1 risk-reward or measured move equal to the full candle range.
Best Conditions
- Timeframe: daily
- Timeframe: 4h
- Timeframe: weekly
- at resistance in uptrends
- overbought conditions
- after parabolic moves
- Asset: stocks
- Asset: forex
- Asset: crypto
- Asset: commodities
Avoid When
- Timeframe: 1m
- Timeframe: 5m
- strong uptrends with fundamental catalysts
- low liquidity
- mid-range positions
Confluence Factors
- Pattern forms at a key resistance level
- RSI is overbought (above 70)
- The upper shadow tests a major moving average from below
- Fibonacci extension level alignment
- Bearish divergence on MACD
Scale In Strategy
Short a small position at the doji close, add on bearish confirmation candle close below the low.
Scale Out Strategy
Cover one-third at TP1, trail the rest with a lower-high trailing stop.
Risk Management
Volume Analysis
Volume Confirmation
High volume on the Shooting Star Doji indicates genuine selling at the highs. Volume surge on the bearish confirmation candle adds conviction.
Volume Profile
Heavy volume at the upper shadow levels confirms institutional distribution.
Volume Divergence
Declining volume during a rally approaching the doji followed by high volume on the doji itself is a classic distribution signal.
Technical Confluence
Support Resistance
Most powerful when the upper shadow tests and rejects a major resistance level.
Fibonacci Levels
The upper shadow reaching a Fibonacci extension (127.2% or 161.8%) and reversing creates a high-probability short setup.
Moving Averages
The upper shadow testing the 50 or 200 EMA from below and failing confirms the moving average as resistance.
Rsi Confirmation
RSI above 70 with a Shooting Star Doji creates a textbook overbought reversal signal.
Macd Confirmation
MACD bearish divergence at the time of the doji dramatically increases reversal probability.
Bollinger Bands
The upper shadow penetrating the upper Bollinger Band and reversing signals a mean reversion opportunity.
Vwap
Upper shadow reaching above VWAP and failing back below suggests the rally was unsustainable.
Ichimoku Cloud
Upper shadow failing at the Kumo cloud from below confirms the cloud as resistance.
Elliott Wave
Frequently marks the end of Wave 5 or Wave B, where the last push higher fails.
Wyckoff Phase
Can represent the Upthrust in Wyckoff distribution — a false break above resistance that reverses.
Market Profile
Upper shadow testing the Value Area High and failing signals rejection of higher value.
Order Flow
Aggressive sell orders at the upper shadow levels with absorption of buy orders confirm distribution.
Open Interest
Rising open interest at the upper shadow may indicate new short positions being established.
Multi-Timeframe Analysis
Higher Timeframe Alignment
A daily shooting star doji at a weekly resistance level provides maximum reversal conviction.
Lower Timeframe Entry
After a daily shooting star doji, use the 1-hour chart to short on a break below the daily doji low.
Timeframe Confluence
Shooting star doji on both daily and 4-hour charts at the same resistance confirms strong supply.
Top-Down Approach
Weekly resistance identifies the level. Daily shooting star doji provides the signal. 4-hour chart provides the entry.
Statistics
Historical Examples
Netflix Gravestone Doji at Resistance
successNFLX printed a shooting star doji at the $480 resistance level after earnings. The upper shadow tested $490 but closed at $475, leading to a decline toward $420.
Lesson: Shooting star doji at resistance with post-earnings context creates high-probability short setups.
Bitcoin Gravestone Doji False Signal
failureBTC formed a shooting star doji at $34,000 during a strong rally. Price paused briefly but then broke above $35,000 the following week.
Lesson: In strong momentum environments, shooting star doji can be overcome by persistent buying pressure.
EUR/USD Gravestone at Trendline
successEUR/USD formed a shooting star doji at a descending trendline resistance near 1.0950. The rejection led to a 100-pip decline.
Lesson: Shooting star doji at dynamic resistance (trendlines) are as effective as at horizontal resistance.
Variations
Long-Shadow Shooting Star Doji
A shooting star doji with an exceptionally long upper shadow, exceeding 3x the average candle range.
Near-Shooting Star Doji
A shooting star shape with a barely visible body, not quite a doji but functionally similar.
Confusion Matrix
Patterns commonly confused with Shooting Star Doji and how to distinguish them.
Bearish Shooting Star
8500% similarIf there is a visible real body, it is a Shooting Star. If the open and close are identical, it is a Shooting Star Doji.
Key Differences
- Bearish Shooting Star has a small real body; Shooting Star Doji has no body
- Bearish Shooting Star is classified as bearish; this pattern is neutral
Neutral Hammer Doji
3000% similarLook at which end has the long shadow. Lower shadow = Hammer Doji. Upper shadow = Shooting Star Doji.
Key Differences
- Hammer Doji has a long lower shadow; Shooting Star Doji has a long upper shadow
- They are mirror images of each other
The gravestone doji is a single-candle reversal pattern with the open, close, and low at the same level and a long upper shadow, resembling a gravestone. It signals that buyers pushed price higher but sellers reclaimed all gains by the close.
The shooting star is a single-candle bearish reversal pattern with a small body near the low and a long upper shadow. It shows that buyers pushed price significantly higher during the session but sellers drove it back down, signaling a potential top.
The Doji is the quintessential indecision candle where opening and closing prices are virtually identical, reflecting a perfect tug-of-war between buyers and sellers.
The Hammer Doji (Dragonfly Doji) features a long lower shadow with the open and close at the session high, showing that sellers drove price down sharply but buyers recovered all losses, creating a neutral signal that depends on context.
The Bearish Belt Hold is a single bearish candle that opens at its high and closes near its low with a long body, indicating that sellers dominated from the opening bell and controlled price action throughout the session.
The Bearish Closing Marubozu is a single bearish candle with no lower shadow — the close is at the exact low of the session. This indicates that sellers controlled the session and maintained pressure through the very last trade, a sign of strong bearish conviction.
Pro Tips & Common Mistakes
Pro Tips
- The longer the upper shadow, the more significant the rejection of higher prices
- In uptrends, the Shooting Star Doji is a strong reversal warning — treat it seriously
- Volume at the upper shadow levels provides crucial context — high volume confirms distribution
- Use the upper shadow high as a key resistance level for future reference
- Combine with RSI overbought readings for the highest probability short setups
Common Mistakes
- Automatically shorting without considering the trend context and strength
- Ignoring that in downtrends, the shooting star doji may simply be a temporary bounce that fails
- Placing stops too tight within the upper shadow instead of above it
- Not waiting for confirmation from the next candle
- Confusing the Shooting Star Doji (long upper shadow) with the Hammer Doji (long lower shadow)
Advanced Techniques
- Use the upper shadow as a supply zone for future limit sell orders
- Combine with footprint charts to see if the selling at the highs was aggressive (market sells) or passive (limit sells)
- On lower timeframes, the shooting star doji typically appears as an inverted V pattern that can be traded for short entry refinement
- Use the shadow range to calibrate put option strike selection
Institutional Perspective
Institutional traders use the rally phase of the Shooting Star Doji to distribute long positions. The long upper shadow often represents institutional limit sell orders that were filled during the session. The complete reversal back to the open confirms that distribution is complete at those price levels.
Fun Facts
- The Japanese name 'Tohba' means gravestone or Buddhist stupa, reflecting the candle's association with endings and burial of the day's gains.
- The Gravestone Doji is one of the few patterns with an inherently ominous name in both Eastern and Western candlestick traditions.
- The shooting star doji has the mirror twin — the hammer doji (dragonfly doji) — creating a yin-yang pair in candlestick theory.
Frequently Asked Questions
A Shooting Star Doji (Gravestone Doji) is a single candle with no real body at the session low and a long upper shadow, showing that buyers rallied price higher but sellers reversed all gains completely.
They are mirror images. The Shooting Star Doji has a long upper shadow (rejection of higher prices), while the Hammer Doji has a long lower shadow (rejection of lower prices).
No, but it has a bearish lean because it shows rejection of higher prices. In uptrends at resistance, it is most bearish. In downtrends, it can be a weak bounce signal. Always consider context.