Overview
Bearish Flag
Also known as: Bear Flag, Descending Flag, Continuation Flag
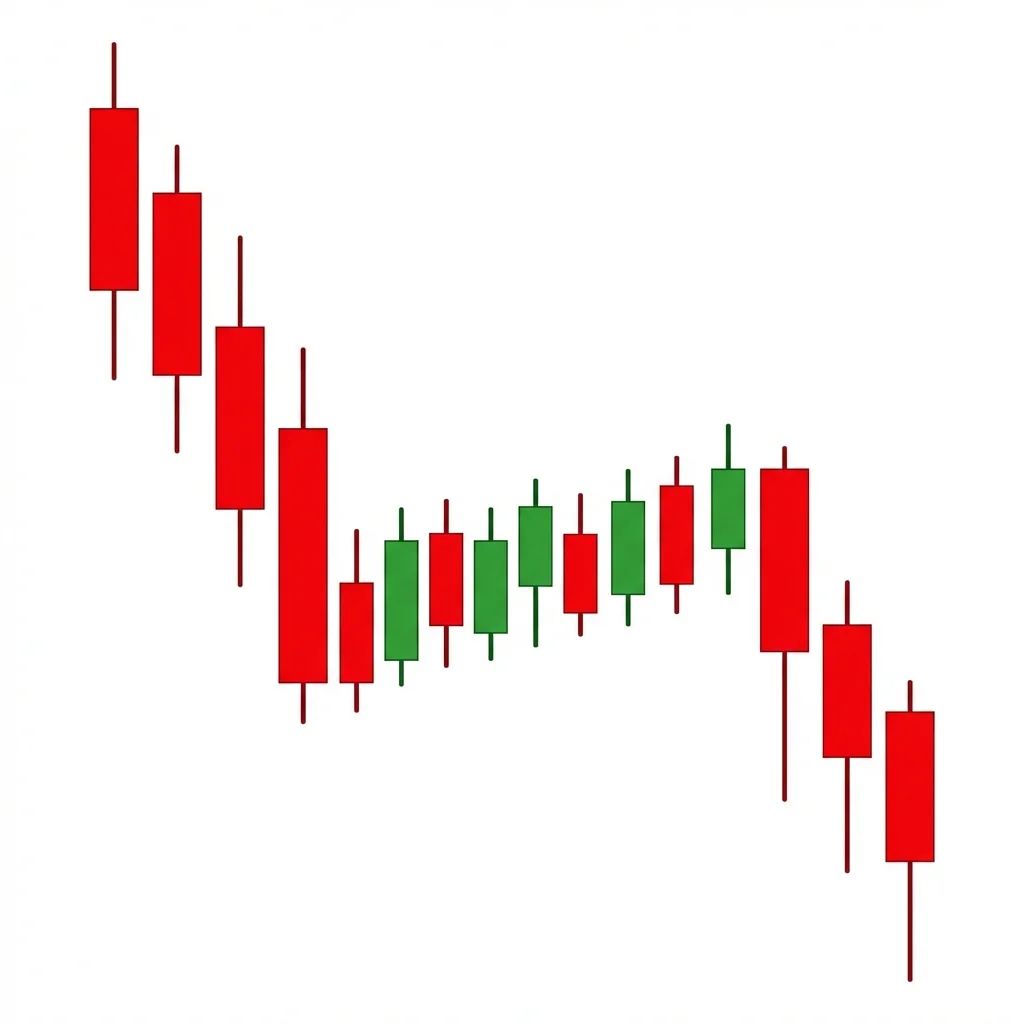
The bearish flag is a continuation pattern consisting of a sharp decline (flagpole) followed by a gentle upward-sloping consolidation (flag) before price breaks down to continue the trend.
The bearish flag is one of the most popular and reliable continuation patterns in technical analysis. It forms when a strong selling impulse (the flagpole) is followed by a brief consolidation period where price drifts upward in a narrow, parallel channel. This consolidation represents a pause in selling rather than a reversal — sellers are resting while weak-handed shorts take profits. The pattern completes when price breaks below the flag's lower boundary with increased volume, resuming the original downtrend. The expected measured move equals the length of the flagpole projected from the breakdown point.
History & Etymology
Flag patterns have been recognized in Western technical analysis since the early 20th century. Charles Dow and later Richard Schabacker documented these formations as 'continuation patterns' in the 1930s. The pattern gained widespread popularity through Edwards and Magee's 'Technical Analysis of Stock Trends' (1948), which provided detailed classification of flags and pennants.
The pattern is named for its visual resemblance to a flag on a pole. The sharp initial move forms the 'pole,' and the rectangular consolidation channels form the 'flag' itself, appearing to wave in the wind.
How It Forms
Formation Steps
- 1Sharp, steep decline forming the flagpole
- 2Consolidation phase with price drifting upward in a parallel channel (the flag)
- 3Breakdown below the lower boundary of the flag channel
- 4Continuation of the downtrend with volume expansion
Prerequisites
- Strong impulsive move down (flagpole)
- Consolidation on declining volume
Confirmation Signals
- Break below the flag's lower trendline
- Volume surge on the breakdown
- Price closes below the flag support on the daily chart
Invalidation Signals
- Price breaks above the upper boundary of the flag
- Volume increases during the consolidation (accumulation)
- Flag retraces more than 50% of the flagpole
Candle Breakdown
Flagpole Candles
A series of strong bearish candles forming a steep decline, typically 3-8 candles with large bodies and increasing volume.
Aggressive selling creates panic and momentum. This is the impulse wave driven by institutional distribution.
Flag Candles
Smaller candles drifting upward in a channel, forming the consolidation phase. Volume should diminish throughout.
Short-term profit-taking and counter-trend buying create a gentle drift up, but conviction is lacking.
Breakdown Candle
A strong bearish candle breaking below the lower boundary of the flag channel with expanding volume.
Sellers return with force, overwhelming the brief consolidation and triggering stops of counter-trend buyers.
Psychology
The flag represents a brief rest in an otherwise powerful selling trend. Weak bears take profits while new sellers enter, creating a gentle upward drift that ultimately fails as the dominant selling force resumes.
Buyer Perspective
Counter-trend buyers see the consolidation as a potential bottom and buy into the rally. They are lulled into complacency by the rising prices, only to be trapped when the breakdown occurs.
Seller Perspective
Smart sellers use the flag consolidation to add to short positions at better prices. They recognize the declining volume and shallow rally as a lack of real buying conviction.
Smart Money Action
Institutions use the flag rally to reload short positions. They may even buy small quantities to push price into the flag zone before reversing with large sell orders on the breakdown.
Retail Trader Trap
Retail traders often buy the flag thinking the worst is over. The gentle uptrend within the flag creates false confidence. The breakdown triggers their stops, adding fuel to the move.
Emotional Cycle
Trading Strategy
Aggressive Entry
Enter short when price touches the upper boundary of the flag channel for the second or third time, anticipating the breakdown.
Conservative Entry
Wait for a confirmed close below the flag's lower trendline with above-average volume, then enter on the next candle's open.
Flagpole length projected downward from the breakdown point.
1.5x the flagpole length for extended moves.
Major support level or prior significant low.
Best Conditions
- Timeframe: daily
- Timeframe: 4h
- Timeframe: 1h
- trending down
- high volatility
- bear market
- Asset: stocks
- Asset: indices
- Asset: futures
- Asset: crypto
Avoid When
- Timeframe: 1m
- Timeframe: 5m
- sideways
- low volatility
- reversal markets
Confluence Factors
- Flag forms at a broken support turned resistance
- 50 EMA acts as resistance near the top of the flag
- RSI stays below 50 during the entire flag formation
- MACD remains negative throughout consolidation
- Sector or index also in downtrend
Scale In Strategy
Enter 50% at breakdown, add 50% on a pullback to the broken flag support (now resistance).
Scale Out Strategy
Take 33% off at flagpole measured move, 33% at 1.5x, trail final 33%.
Risk Management
Volume Analysis
Volume Confirmation
Volume must decline during the flag formation and expand on the breakdown. This is a critical filter.
Volume Profile
The flag area should show a low-volume node, indicating temporary and weak participation.
Volume Divergence
If volume increases during the flag formation, be cautious — it may indicate accumulation rather than consolidation.
Technical Confluence
Support Resistance
The flag's lower boundary becomes the trigger line. Once broken, the flag zone becomes resistance on any retest.
Fibonacci Levels
The flag typically retraces 23.6% to 38.2% of the flagpole. Retrace beyond 50% invalidates the pattern.
Moving Averages
The 20 EMA often acts as dynamic resistance at the top of the flag. Price rejecting off the 20 EMA strengthens the setup.
Rsi Confirmation
RSI should stay below 50 during the flag and turn down before the breakdown. A reading near 40-45 at breakdown is ideal.
Macd Confirmation
MACD should remain in negative territory. A bearish crossover within the flag formation is a strong confirmation signal.
Bollinger Bands
Bands compress during the flag (low volatility), then the breakdown candle should push through the lower band.
Vwap
Price should remain below VWAP during the flag formation on intraday charts, confirming sellers are in control.
Ichimoku Cloud
Flag forming below the Kumo cloud with the Tenkan-Sen crossing below the Kijun-Sen during consolidation is ideal.
Elliott Wave
Bear flags often form in Wave 2 or Wave 4 positions within an impulsive decline, with the flagpole being the impulse wave.
Wyckoff Phase
Bear flags resemble brief automatic rally (AR) phases within the larger markdown. The breakdown is the continuation of the sign of weakness.
Market Profile
The flag creates a balance area above the breakdown point. A break from balance typically leads to a move equal to the initial balance range.
Order Flow
Watch for aggressive selling (market sell orders) to increase as price approaches the flag's lower boundary. Passive sellers accumulate at the flag's upper edge.
Open Interest
In futures, rising open interest during the flag suggests new short positions building. A spike in OI on the breakdown confirms the move.
Multi-Timeframe Analysis
Higher Timeframe Alignment
A bear flag on the daily chart within a weekly downtrend is the ideal setup. Verify the weekly chart shows lower highs and lower lows.
Lower Timeframe Entry
Use the 15m or 1H chart to find a lower timeframe bearish pattern (engulfing, shooting star) at the flag's upper boundary for precise entries.
Timeframe Confluence
The flag should be visible on both the 4H and daily charts. If the 4H flag breaks down while the daily flag is still forming, use the 4H signal for early entry.
Top-Down Approach
Weekly trend bearish → Daily bear flag forming → 4H breakdown signal → 1H entry pattern at the flag's lower boundary.
Statistics
Historical Examples
Meta Platforms Bear Flag 2022
successAfter dropping 25% post-earnings, META formed a textbook bear flag over two weeks, rallying gently to the 20 EMA before breaking down and falling another 30% over the following months.
Lesson: Bear flags after earnings gaps are among the most reliable setups, as the fundamental catalyst reinforces the technical pattern.
Bitcoin Bear Flag 2022
successBitcoin dropped from $40K to $30K forming the flagpole, consolidated between $29-31K in a gentle upward-sloping channel, then broke down to $17.5K over the next month.
Lesson: Crypto bear flags can have extreme measured moves. The flagpole projection was nearly perfectly achieved.
Variations
Tight Bear Flag
A very narrow flag with minimal price range, lasting only 3-5 candles.
Wide Bear Flag
A flag with a wider channel that retraces 38-50% of the flagpole.
Bear Flag with Gap Breakdown
The flag breaks down with a gap rather than a gradual push through the lower boundary.
Confusion Matrix
Patterns commonly confused with Bearish Flag and how to distinguish them.
Bearish Pennant
85% similarDraw the consolidation trendlines — if they are roughly parallel and slope upward, it is a flag. If they converge to a point, it is a pennant.
Key Differences
- Flags have parallel channel lines; pennants have converging trendlines
- Flags drift upward; pennants are roughly symmetrical
- Flags typically last longer than pennants
Bearish Descending Channel
50% similarCheck for the flagpole — without a sharp preceding impulse move, you are looking at a channel, not a flag.
Key Differences
- A descending channel is the trend itself, not a consolidation within a trend
- Flags are short-duration; channels can last weeks or months
- Flags require a preceding sharp move (flagpole)
The Descending Channel is a chart formation where price trends lower within two parallel downward-sloping trendlines, making consistent lower highs and lower lows in an orderly bearish progression.
A bearish pennant is a continuation pattern that forms after a sharp decline, creating a small symmetrical triangle as the market consolidates before resuming its downward move. The measured target equals the flagpole's length projected from the breakout point.
A bearish rectangle breakdown occurs when price trades in a horizontal range between parallel support and resistance before breaking below support. The measured move target equals the height of the rectangle projected downward from the breakdown point.
The Bullish Flag is the quintessential continuation pattern: a sharp rally (pole) followed by a brief, tight consolidation (flag) before the next leg up. It represents a healthy pause in a strong uptrend.
The Broadening Top (Megaphone) is a chart formation characterized by expanding price swings that create higher highs and lower lows, reflecting increasing volatility and instability at market tops before a bearish breakdown.
The Descending Triangle is a bearish continuation pattern featuring a flat support level with lower highs converging into an apex, typically resolving with a breakdown below the horizontal support as sellers gradually overwhelm buyers.
Pro Tips & Common Mistakes
Pro Tips
- The best bear flags have declining volume throughout the entire flag formation — this is the single most important filter.
- Measure the flagpole from the start of the impulse to the flag's beginning for the most accurate measured move target.
- Bear flags that form in less than 5 candles and retrace less than 23.6% of the flagpole have the highest win rates.
- Use the flag's upper trendline as your invalidation — if price closes above it, the pattern is likely failed.
Common Mistakes
- Trading flags in rangebound markets — they only work in trending conditions.
- Entering before the breakdown is confirmed — patience pays with flags.
- Ignoring the volume pattern — rising volume during the flag is a warning sign.
- Using the wrong reference point for the measured move calculation.
- Confusing a flag with a genuine reversal pattern.
Advanced Techniques
- Combine volume profile analysis with the flag — low-volume nodes within the flag area confirm weak participation.
- Use options flow to confirm institutional positioning: look for put buying or call selling during the flag.
- Monitor dark pool prints during the flag — large prints at the upper flag boundary confirm institutional selling.
- Use the flagpole's VWAP as a dynamic resistance level within the flag.
Institutional Perspective
Institutions view bear flags as optimal reload zones for adding to short positions. The gentle rally within the flag provides better execution prices. Many algorithmic trading systems specifically scan for bear flags and auto-execute on breakdowns.
Fun Facts
- Bear flags are considered one of the 'bread and butter' patterns by professional day traders — many traders build their entire strategy around flag patterns.
- Studies show that bear flags with flagpoles formed by fewer than 5 candles tend to be the most reliable.
- The bear flag was one of the first patterns to be successfully coded into early algorithmic trading systems in the 1990s.
Frequently Asked Questions
A bearish flag is a continuation pattern consisting of a sharp decline (flagpole) followed by a gentle upward-sloping consolidation (flag). The pattern signals that the downtrend will likely continue after the brief pause.
Measure the height of the flagpole (from the start of the sharp decline to the beginning of the flag). Project that distance downward from the breakdown point of the flag to get your target.
Volume should decline during the flag consolidation phase and then expand significantly on the breakdown. Declining volume during the flag shows weak buying, while expanding volume on the breakdown confirms renewed selling pressure.