Overview
Bearish Lower Highs
Also known as: Descending Highs, Lower Peaks, Bearish Trend Structure
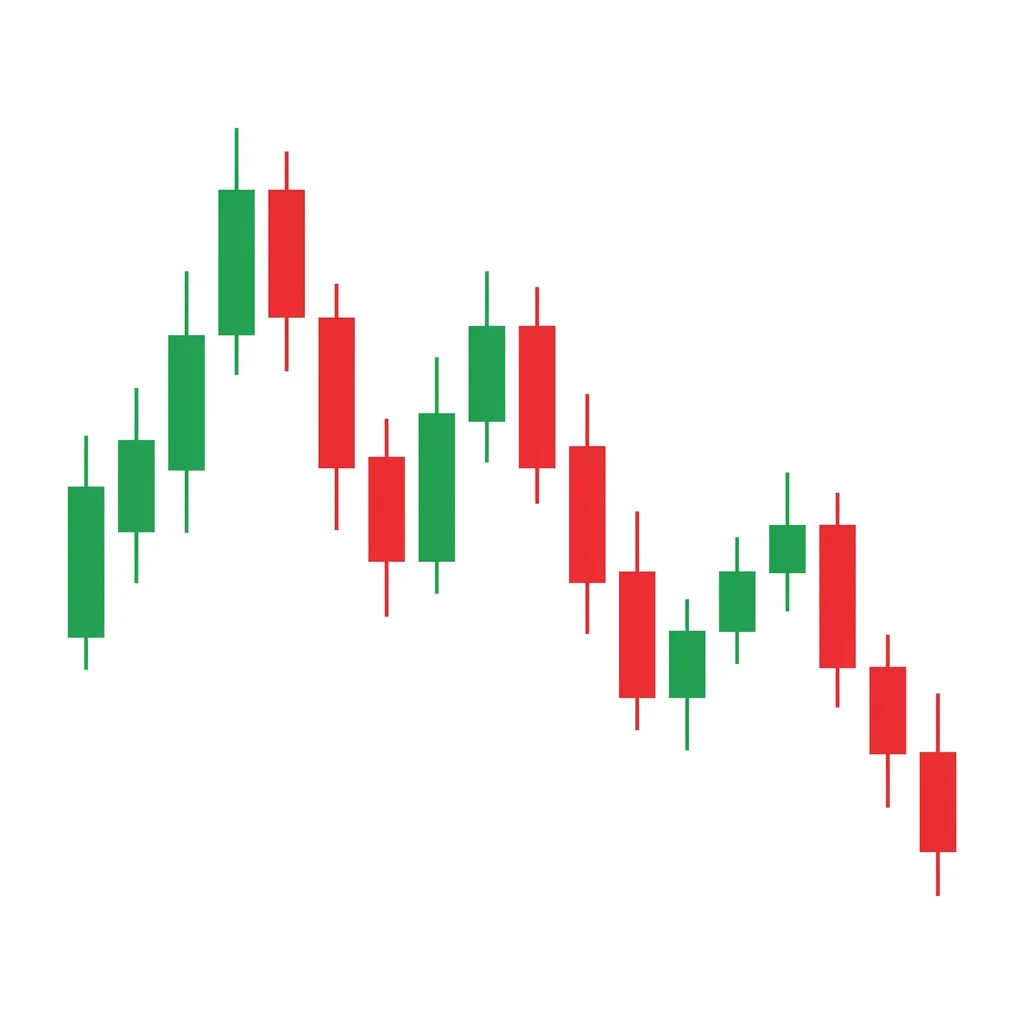
Bearish lower highs is a fundamental trend structure pattern where each successive swing high forms at a lower level, confirming bearish momentum and a downtrend. It is the most basic and important bearish market structure signal.
The lower highs pattern is arguably the most fundamental concept in bearish technical analysis. A downtrend is defined by a series of lower highs and lower lows. When each rally attempt peaks at a lower level than the previous one, it shows that sellers are progressively more aggressive and buyers are progressively weaker. The pattern is not a single event but a structural condition that confirms the trend. Traders draw a descending trendline connecting the lower highs to visualize the pattern and identify where future rallies are likely to be rejected.
History & Etymology
The concept of lower highs and lower lows as the definition of a downtrend dates back to Charles Dow in the late 19th century. It is one of the foundational principles of Dow Theory and remains the basis of trend identification in all forms of technical analysis.
The name is purely descriptive: each 'high' (swing peak) is 'lower' than the one before it. The term has been used since the earliest days of Western technical analysis.
How It Forms
Formation Steps
- 1First swing high establishes the reference point
- 2Second swing high forms below the first
- 3Third swing high forms below the second (confirming the pattern)
- 4Each rally fails at a lower level than the previous one
Prerequisites
- At least two swing highs for comparison
- Preceding uptrend or neutral trend that is transitioning
Confirmation Signals
- Three or more consecutive lower highs
- Lower lows accompanying lower highs
- Volume declining on each rally attempt
Invalidation Signals
- A swing high forms above the most recent lower high
- Price breaks above the descending trendline connecting highs
- Strong volume on a rally exceeding the prior high
Candle Breakdown
First High
The initial swing high that establishes the reference level.
This is the level that subsequent rallies fail to reach.
Lower High
A subsequent swing high that forms below the prior high.
Buyers cannot push price as high as before. Selling pressure is increasing.
Even Lower High
The third consecutive lower high confirms the pattern.
The trend is confirmed. Each rally attempt is weaker, showing progressive seller domination.
Psychology
Lower highs reflect the gradual but persistent weakening of buying pressure. Each rally attempt demonstrates that buyers have less conviction, while sellers become more aggressive at progressively lower prices.
Buyer Perspective
Buyers attempt rallies but cannot recapture prior highs. Each failed attempt demoralizes them further, leading to reduced participation and eventual capitulation.
Seller Perspective
Sellers gain confidence with each lower high. They sell at progressively lower levels, knowing that buying pressure is waning with each rally.
Smart Money Action
Institutions sell into each rally, creating the lower highs. Each rally provides an opportunity to distribute at progressively lower but still favorable prices.
Retail Trader Trap
Retail traders buy each dip hoping for a reversal. Each lower high traps them at worse levels.
Emotional Cycle
Trading Strategy
Aggressive Entry
Short at the descending trendline connecting the lower highs when price rallies to it.
Conservative Entry
Short after price touches the trendline and forms a bearish rejection candle.
The most recent swing low.
A new lower low beyond the recent swing low.
Major support level below.
Best Conditions
- Timeframe: daily
- Timeframe: 4h
- Timeframe: 1h
- Timeframe: weekly
- downtrend
- bear market
- sector weakness
- Asset: stocks
- Asset: forex
- Asset: indices
- Asset: crypto
- Asset: commodities
Avoid When
- Timeframe: 1m
- reversal beginning
- V-bottom
Confluence Factors
- Moving averages sloping down
- RSI below 50
- MACD negative
- Sector weakness
- Volume declining on rallies
Scale In Strategy
Add to position at each subsequent lower high with the trendline as your guide.
Scale Out Strategy
Take partial profits at each new lower low.
Risk Management
Volume Analysis
Volume Confirmation
Volume should decline on each rally (lower high) and increase on the declines.
Volume Profile
Each lower high area should show lower volume than the prior one.
Volume Divergence
Increasing volume on a rally suggests the lower highs pattern may be ending.
Technical Confluence
Support Resistance
The descending trendline connecting lower highs acts as dynamic resistance.
Fibonacci Levels
Each rally often retraces 38.2% or 50% of the prior decline before forming the next lower high.
Moving Averages
Declining 20 and 50 EMA often coincide with the lower high trendline, providing additional resistance.
Rsi Confirmation
RSI staying below 50-60 during each rally confirms the bearish structure.
Macd Confirmation
MACD remaining negative confirms the downtrend behind the lower highs.
Bollinger Bands
Each rally reaching the middle or upper band and failing confirms the pattern.
Vwap
Rallies failing at declining VWAP on daily charts confirms institutional selling.
Ichimoku Cloud
Price staying below the Kumo cloud with each rally failing at the cloud edge.
Elliott Wave
Lower highs typically form in corrective Wave 2 and Wave 4 within an impulsive decline.
Wyckoff Phase
Lower highs are characteristic of the markdown phase, with each rally being an automatic reaction that fails.
Market Profile
Value area migrating lower with each session confirms the structural decline.
Order Flow
Sell limit orders accumulating at progressively lower levels create the descending trendline.
Open Interest
Rising put OI at each lower high confirms institutional bearish positioning.
Multi-Timeframe Analysis
Higher Timeframe Alignment
Lower highs on the weekly provide the strongest trend confirmation.
Lower Timeframe Entry
Use the 4H chart to time entries at each lower high for precise risk management.
Timeframe Confluence
Lower highs on both daily and weekly confirm a strong downtrend.
Top-Down Approach
Monthly trend → Weekly lower highs → Daily entry at each lower high.
Statistics
Historical Examples
S&P 500 Lower Highs 2022
successThe S&P 500 made a series of lower highs throughout 2022: January high, March high (lower), August high (lower). Each rally failed at a lower level, confirming the bear market.
Lesson: Lower highs in the broader market indices confirm bear market conditions and provide clear short entry levels.
EUR/USD Lower Highs
successEUR/USD made consistent lower highs from February to September 2022, declining from 1.14 to below 0.96. Each rally to the trendline was rejected.
Lesson: Forex pairs in strong trends create textbook lower highs patterns that can persist for months.
Variations
Accelerating Lower Highs
Each lower high is significantly lower than the prior one, showing accelerating weakness.
Shallow Lower Highs
Each lower high is only slightly lower than the prior one.
Confusion Matrix
Patterns commonly confused with Bearish Lower Highs and how to distinguish them.
Bearish Descending Channel
80% similarIf the lower highs and lower lows create two roughly parallel descending lines, it is a channel. If the highs decline but the structure is less uniform, it is simply lower highs.
Key Differences
- Lower highs is the structural concept; descending channel is the visual formation
- A channel requires parallel lines; lower highs just needs declining peaks
- Lower highs is more flexible in structure
The Descending Channel is a chart formation where price trends lower within two parallel downward-sloping trendlines, making consistent lower highs and lower lows in an orderly bearish progression.
The Descending Triangle is a bearish continuation pattern featuring a flat support level with lower highs converging into an apex, typically resolving with a breakdown below the horizontal support as sellers gradually overwhelm buyers.
The bearish flag is a continuation pattern consisting of a sharp decline (flagpole) followed by a gentle upward-sloping consolidation (flag) before price breaks down to continue the trend.
The bearish staircase down is a trend continuation pattern characterized by a rhythmic series of lower highs and lower lows, creating a step-like descending structure. Each step represents a decline followed by a partial recovery that fails to reclaim the prior high.
The Higher Lows pattern is the most fundamental bullish structure, showing that buyers are willing to step in at progressively higher prices, indicating strengthening demand and a healthy uptrend.
The Broadening Top (Megaphone) is a chart formation characterized by expanding price swings that create higher highs and lower lows, reflecting increasing volatility and instability at market tops before a bearish breakdown.
Pro Tips & Common Mistakes
Pro Tips
- Three or more lower highs confirm the pattern — two could be coincidence.
- Draw a trendline connecting the lower highs and use it as your entry zone for shorts.
- Volume should decline on each rally — this confirms weakening buying pressure.
- The pattern is invalidated only when a swing high forms ABOVE the prior lower high.
Common Mistakes
- Buying dips in a lower highs pattern hoping for reversal.
- Not recognizing lower highs early enough — many traders only see the pattern after it is well-established.
- Trying to short at the exact trendline without a rejection candle for confirmation.
- Ignoring volume patterns that might indicate the lower highs sequence is ending.
Advanced Techniques
- Use Fibonacci retracement of each decline to predict where the next lower high will form.
- Combine with market structure analysis: lower highs and lower lows together define the downtrend.
- Monitor when a lower high forms at a lower Fibonacci level than the prior one — this shows accelerating weakness.
- Use the trendline break as the reversal signal — when price closes above the descending trendline, the pattern is over.
Institutional Perspective
Lower highs are the structural evidence of institutional distribution. Each rally provides an opportunity for institutions to sell at progressively lower but still acceptable prices.
Fun Facts
- Charles Dow defined a downtrend as 'successive lower highs and lower lows' — this definition has not changed in over 125 years.
- Lower highs is arguably the single most important concept in all of technical analysis — it defines the trend itself.
- Algorithmic trend-following systems are fundamentally based on the lower highs/higher lows concept.
Frequently Asked Questions
Lower highs occur when each successive swing high (rally peak) forms at a lower level than the previous one. This pattern confirms a downtrend and is the most basic bearish market structure signal.
Two lower highs suggest a potential downtrend, but three or more consecutive lower highs provide strong confirmation. The more lower highs in sequence, the more established the trend.
The pattern ends when price makes a swing high that is ABOVE the most recent lower high, breaking the sequence. A trendline break above the descending highs line confirms the end.