Overview
Bullish Ascending Channel
Also known as: Rising Channel, Upward Channel, Bullish Parallel Channel
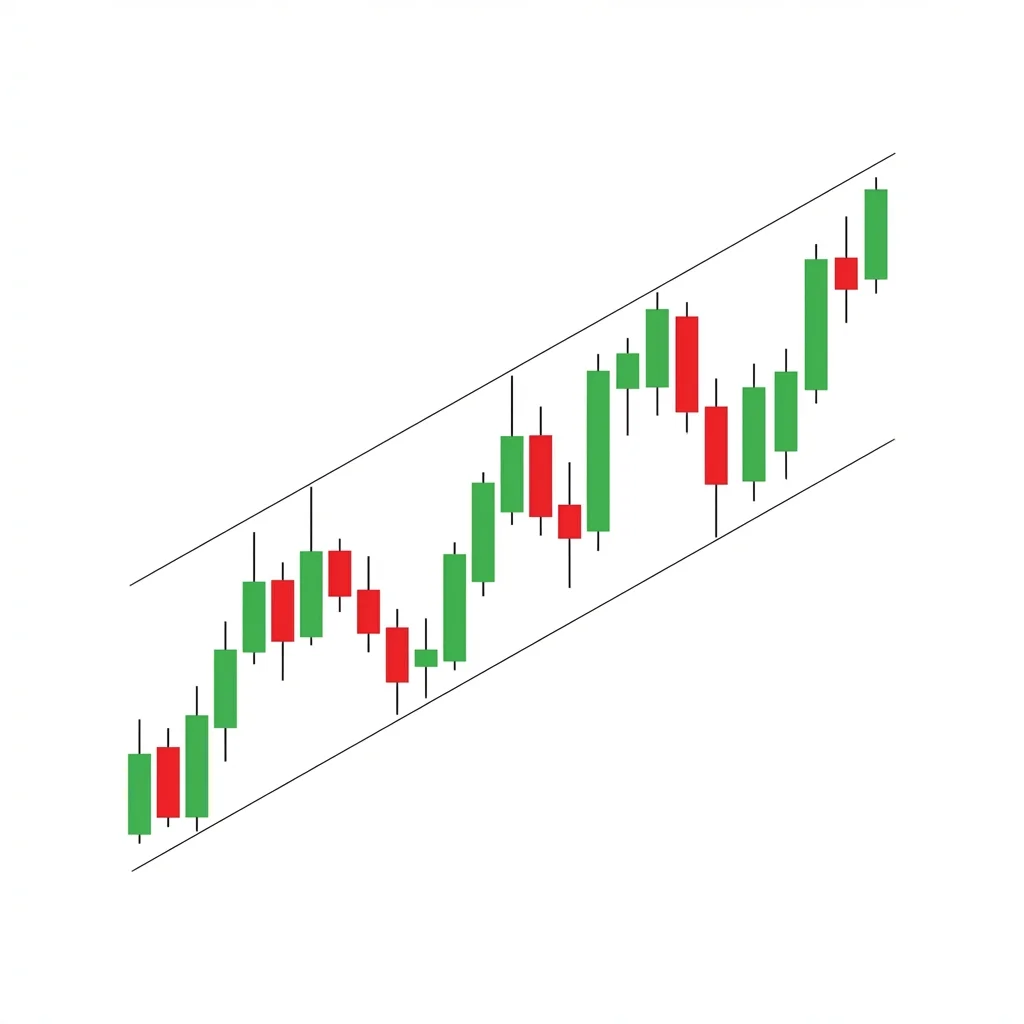
The Bullish Ascending Channel is a continuation pattern where price trends upward within two parallel trendlines, providing clear buy zones at the lower boundary and profit targets at the upper boundary.
An ascending channel forms when price makes a series of higher highs and higher lows that can be contained between two parallel, upward-sloping trendlines. The lower trendline acts as dynamic support and the upper trendline as dynamic resistance. Traders use the channel to buy at the lower boundary and sell or take partial profits at the upper boundary. The pattern continues until price breaks out — either upward (bullish breakout signaling acceleration) or downward (trend reversal). Channels are among the most intuitive and tradable patterns because they provide clear, repeatable entry and exit levels.
History & Etymology
Channel analysis dates back to the earliest days of technical analysis. Charles Dow discussed the concept of price moving in trends bounded by support and resistance. The formal study of parallel channels was advanced by Edson Gould in the 1960s and later by traders like Linda Raschke who used channel trading as a core strategy.
The term 'channel' comes from the visual similarity to a waterway — price flows within defined banks (the trendlines), just as water flows within a channel.
How It Forms
Formation Steps
- 1Two upward-sloping parallel trendlines containing price action
- 2Lower trendline connects at least two higher lows (support)
- 3Upper trendline connects at least two higher highs (resistance)
- 4Price oscillates between the two lines, respecting both boundaries
Prerequisites
- At least two touches of both the upper and lower trendlines
- Trendlines must be approximately parallel
- Clear upward slope in both lines
Confirmation Signals
- Third touch of the lower trendline with a bullish bounce
- Volume increases on bounces from the lower trendline
- Price respects channel boundaries consistently
Invalidation Signals
- Price breaks below the lower trendline with volume
- Channel becomes too wide or trendlines lose parallelism
- Volume expands on declines within the channel
Candle Breakdown
Channel Low Bounce
A bullish candle forming at or near the lower trendline, confirming support.
Buyers step in at the known support level. Each successful bounce reinforces the channel and builds confidence in the pattern.
Mid-Channel Movement
Price moves through the middle of the channel toward the upper trendline.
Price transits between support and resistance in an orderly fashion. Traders are comfortable with the range.
Channel High Test
Price approaches or touches the upper trendline, where profit-taking typically occurs.
Short-term traders take profits at the upper boundary. Some counter-trend traders may initiate short positions here.
Psychology
Ascending channels represent orderly uptrends where buyers and sellers have found a rhythm. Buyers consistently step in at the lower boundary, and sellers take profits at the upper boundary, creating a predictable cycle.
Buyer Perspective
Buyers are confident in the trend and view pullbacks to the lower trendline as discounted entries. Each successful bounce reinforces their conviction.
Seller Perspective
Sellers are not aggressive — they are primarily profit-takers at the upper boundary, not new shorts. This keeps the trend intact.
Smart Money Action
Institutional traders use ascending channels to systematically add to positions on dips to the lower trendline and lighten at the upper trendline, managing their exposure within the trend.
Retail Trader Trap
Retail traders often buy at the upper trendline (chasing) and sell at the lower trendline (panic), doing the opposite of what channel trading requires.
Emotional Cycle
Trading Strategy
Aggressive Entry
Buy when price touches or comes within 1 ATR of the lower trendline with any bullish candle.
Conservative Entry
Wait for a confirmed bullish reversal candle (hammer, engulfing) at the lower trendline before entering.
At the upper trendline (the channel resistance).
At the channel midline for a conservative approach.
Above the upper trendline if expecting a breakout acceleration.
Best Conditions
- Timeframe: 1h
- Timeframe: 4h
- Timeframe: daily
- Timeframe: weekly
- Trending markets
- Low-to-moderate volatility
- Healthy bull markets
- Asset: stocks
- Asset: ETFs
- Asset: forex
- Asset: crypto
Avoid When
- Timeframe: 1m
- Choppy, whipsaw markets
- High-volatility crash environments
Confluence Factors
- Lower trendline aligns with a moving average (20 or 50 EMA)
- RSI reaches oversold near the lower trendline
- Fibonacci retracement level coincides with the lower trendline
- Volume spike at the lower trendline touch
Scale In Strategy
Enter 50% at the lower trendline, add 50% once price moves above the channel midline.
Scale Out Strategy
Take 50% at the upper trendline, hold the rest with a trailing stop along the lower trendline.
Risk Management
Volume Analysis
Volume Confirmation
Volume should be higher on bounces from the lower trendline and lower during pullbacks. Declining volume on rallies to the upper line may signal weakening.
Volume Profile
Highest volume should cluster near the lower trendline (accumulation zone).
Volume Divergence
If volume increases on declines and decreases on rallies, the channel may be about to break down.
Technical Confluence
Support Resistance
The lower and upper trendlines ARE the dynamic support and resistance. Horizontal levels within the channel add confluence.
Fibonacci Levels
The channel midline often corresponds to a Fibonacci level. Use Fib fan lines to validate the channel angle.
Moving Averages
The 20 EMA often runs along the channel midline, and the 50 SMA near the lower trendline in well-established channels.
Rsi Confirmation
RSI should oscillate between 40-70 within a healthy ascending channel. Drops below 30 at the lower trendline suggest potential breakdown.
Macd Confirmation
MACD should remain positive and oscillate around the signal line during the channel. Sustained negative MACD warns of breakdown.
Bollinger Bands
Bollinger Bands often align with channel boundaries, providing additional dynamic support/resistance.
Vwap
On intraday channels, bounces from VWAP near the lower trendline are strong entry signals.
Ichimoku Cloud
Price staying above the Kumo cloud while in the channel confirms bullish trend strength.
Elliott Wave
Ascending channels often contain the impulse waves (1-3-5) of an Elliott Wave advance.
Wyckoff Phase
An ascending channel corresponds to the markup phase in Wyckoff analysis.
Market Profile
Each swing within the channel creates value areas that migrate higher, confirming the uptrend.
Order Flow
Look for positive delta at the lower trendline (buyers absorbing sellers) to confirm the bounce.
Open Interest
Rising open interest as price moves through the channel confirms trend participation.
Multi-Timeframe Analysis
Higher Timeframe Alignment
A weekly ascending channel gives context to daily trades — buy at the daily lower trendline when the weekly trend is up.
Lower Timeframe Entry
Use the 1-hour or 4-hour chart to time precise entries when the daily chart touches the lower trendline.
Timeframe Confluence
The strongest signals occur when a 4-hour channel lower trendline aligns with a daily support level.
Top-Down Approach
Weekly confirms uptrend → Daily identifies channel → 4-hour times entry at lower trendline.
Statistics
Historical Examples
Apple Ascending Channel 2023
successApple traded within a well-defined ascending channel from January to July 2023, bouncing from the lower trendline four times before eventually breaking out above the upper trendline near $190.
Lesson: Patience with channel trades pays off. Each bounce from the lower trendline offered a 5-8% swing trade with defined risk.
Variations
Steep Ascending Channel
A channel with a steep angle (above 45 degrees), indicating strong momentum.
Wide Ascending Channel
A broader channel where swings between the boundaries take longer.
Confusion Matrix
Patterns commonly confused with Bullish Ascending Channel and how to distinguish them.
Bullish Falling Wedge
4000% similarDraw both trendlines — if they are parallel, it is a channel. If they converge, it is a wedge.
Key Differences
- Ascending channels have parallel lines; wedges have converging lines
- Channels are continuation patterns; falling wedges are reversal patterns
Bearish Rising Wedge
4500% similarMeasure the distance between the trendlines at the start and end. If it narrows, it is a wedge, not a channel.
Key Differences
- Rising wedges have converging trendlines and are bearish
- Ascending channels have parallel trendlines and are bullish
The Descending Channel is a chart formation where price trends lower within two parallel downward-sloping trendlines, making consistent lower highs and lower lows in an orderly bearish progression.
The Falling Wedge is a bullish pattern with two converging downward-sloping trendlines. The narrowing range compresses energy that is released on an upside breakout, making it both a reversal pattern (after downtrends) and a continuation pattern (during uptrend corrections).
The Bullish Flag is the quintessential continuation pattern: a sharp rally (pole) followed by a brief, tight consolidation (flag) before the next leg up. It represents a healthy pause in a strong uptrend.
The Higher Lows pattern is the most fundamental bullish structure, showing that buyers are willing to step in at progressively higher prices, indicating strengthening demand and a healthy uptrend.
The Bullish Staircase Up is a trend continuation formation consisting of alternating impulse moves and consolidation periods, creating a step-like progression of higher highs and higher lows that confirms a healthy, sustainable uptrend.
The Broadening Top (Megaphone) is a chart formation characterized by expanding price swings that create higher highs and lower lows, reflecting increasing volatility and instability at market tops before a bearish breakdown.
Pro Tips & Common Mistakes
Pro Tips
- The more times the trendlines are touched and respected, the more significant the eventual breakout will be
- Trade the first 2-3 bounces with highest confidence — channels become less reliable over time as they mature
- A breakout above the upper trendline on high volume signals trend acceleration, not a sell signal
- Draw the channel from the lower trendline first (connecting the lows) and then clone a parallel line to the highs
- Channels on higher timeframes (weekly, monthly) can contain trends lasting months or even years
Common Mistakes
- Drawing channels with only one touch point on each line — you need at least two
- Ignoring the channel and buying at the upper trendline (chasing)
- Selling in panic at the lower trendline instead of buying
- Forcing non-parallel trendlines into a channel — if the lines converge, it is a wedge
- Expecting channels to last forever — all channels eventually break
Advanced Techniques
- Use Andrews Pitchfork to identify the median line within the channel for mid-swing entries
- Apply Linear Regression Channel to statistically validate the channel boundaries
- Trade the channel midline as a 'half-way' profit target for conservative traders
- Use Fibonacci channel tool to project extension channels above the current one for breakout targets
Institutional Perspective
Institutions use ascending channels as a framework for systematic portfolio building — buying dips to the lower trendline and rebalancing at the upper trendline. The orderly nature of channels suits algorithmic trading strategies.
Fun Facts
- Some of the longest ascending channels in history have contained entire bull markets — the S&P 500 traded within a massive ascending channel from 2009 to 2020.
- The concept of trading within channels is so fundamental that it is one of the first patterns taught in almost every technical analysis curriculum.
Frequently Asked Questions
You need a minimum of two touches on each trendline (four total) to establish a valid channel. Three or more touches on each line significantly increases the pattern's reliability.
Both are valid strategies. Buying bounces within the channel offers better risk/reward because your stop is close (below the trendline). Buying a breakout above the channel can capture trend acceleration but requires wider stops and may face false breakouts.