Overview
Bullish Ascending Triangle
Also known as: Rising Triangle, Flat-Top Triangle, Right-Angle Triangle
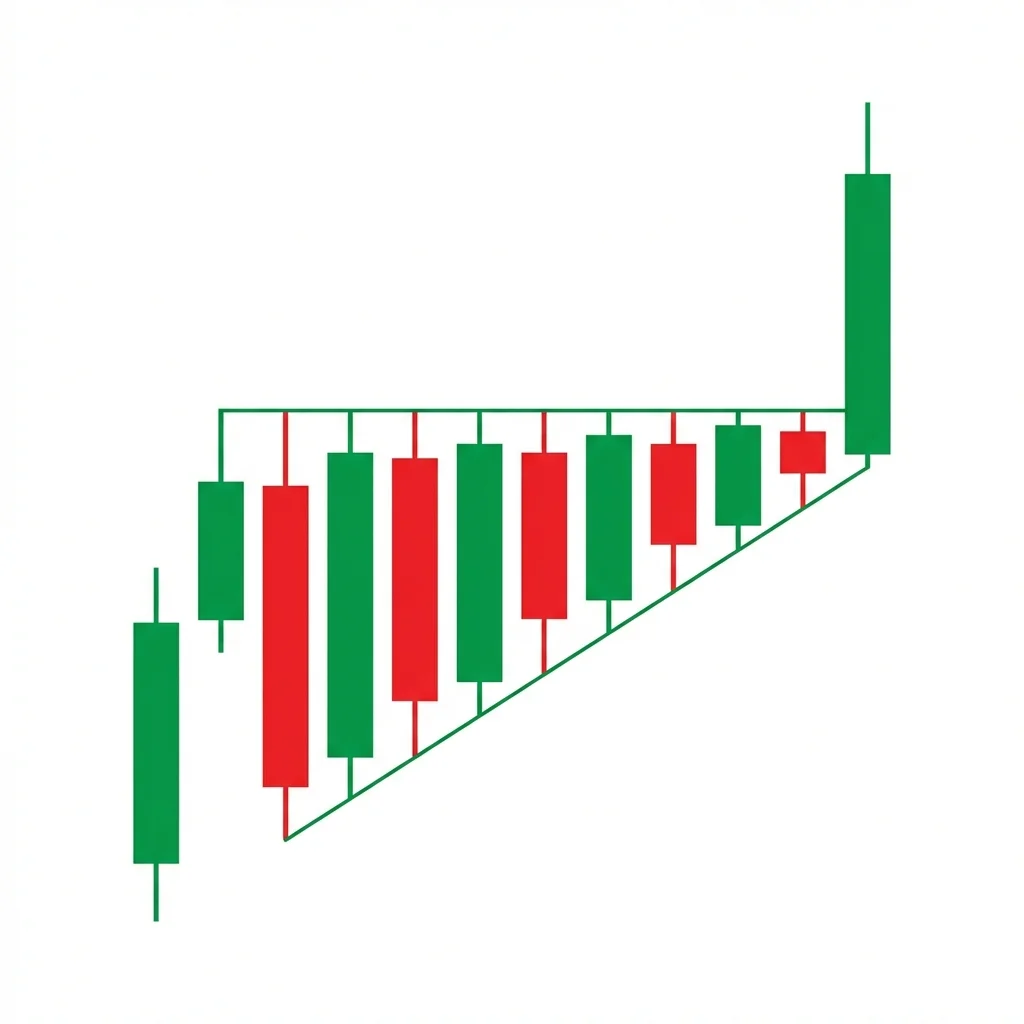
The Bullish Ascending Triangle is a continuation pattern featuring flat resistance and rising support. Buyers are consistently willing to pay higher prices, compressing the range until a breakout above resistance triggers the next leg up.
An ascending triangle forms when buyers are aggressive (creating higher lows) while a specific price level acts as a ceiling (flat resistance). Each rally to resistance meets sellers, but each pullback is shallower than the last, showing that buying pressure is increasing. This compression of energy eventually resolves with a breakout above the flat resistance. The pattern works because the series of higher lows demonstrates growing demand — buyers are becoming less patient and less willing to wait for lower prices. The flat resistance represents a supply level that is being gradually absorbed with each test. When the last remaining sellers at that level are overwhelmed, the breakout occurs.
History & Etymology
The ascending triangle was formally described by Edwards and Magee in their 1948 classic 'Technical Analysis of Stock Trends.' They categorized it as a continuation pattern in uptrends and noted its high breakout reliability. The pattern has been validated by numerous quantitative studies since, including Thomas Bulkowski's extensive pattern research.
Named for its triangular shape with the ascending (rising) lower boundary. The 'ascending' refers to the upward-sloping support line, distinguishing it from descending and symmetrical triangles.
How It Forms
Formation Steps
- 1Flat horizontal resistance line connecting at least two equal highs
- 2Rising support trendline connecting at least two higher lows
- 3Price oscillates between these converging boundaries with decreasing range
- 4Breakout occurs above the flat resistance on volume
Prerequisites
- Prior uptrend or strong rally leading into the triangle
- At least two touches of horizontal resistance
- At least two higher lows forming the ascending support line
Confirmation Signals
- Close above the flat resistance level with above-average volume
- Follow-through buying on the next session
- Volume increases as the breakout occurs
Invalidation Signals
- Price breaks below the ascending support line
- Volume is very low on the breakout (false breakout likely)
- Price falls back below resistance after an initial breakout
Candle Breakdown
Resistance Test
Price rallies to the horizontal resistance and is rejected, forming a high with long upper shadow.
Sellers defend the resistance level, but their rejections are becoming less forceful each time.
Higher Low Formation
Price pulls back but forms a higher low than the previous dip, with a bullish reversal candle.
Buyers are stepping in earlier and at higher prices, showing growing impatience and demand.
Breakout Candle
Price decisively breaks and closes above the flat resistance with strong momentum.
The last resistance sellers are overwhelmed. Stop orders above resistance cascade, fueling the breakout. FOMO kicks in.
Psychology
The ascending triangle is a visual representation of increasing demand meeting fixed supply. Each higher low shows more eager buyers, while the flat resistance slowly weakens with each test until it finally gives way.
Buyer Perspective
Buyers see value at progressively higher prices. Their willingness to pay more on each dip creates the ascending support line. They are accumulating in anticipation of the breakout.
Seller Perspective
Sellers at the resistance level are gradually getting absorbed. Each test of resistance depletes their supply until there are not enough sellers to hold the line.
Smart Money Action
Institutions accumulate during the higher low formations and may place large limit buy orders just above resistance to trigger the breakout cascade.
Retail Trader Trap
Retail traders who short at resistance get squeezed on the breakout. Those who waited for a pullback that never comes miss the move entirely.
Emotional Cycle
Trading Strategy
Aggressive Entry
Enter long when the third higher low forms within the triangle, anticipating the breakout.
Conservative Entry
Wait for a close above the flat resistance on above-average volume, then enter on a pullback to the breakout level.
Measured move: height of the triangle (from flat resistance to lowest low) projected above the breakout point.
1.618x the triangle height for an extended target.
Next major resistance level from higher timeframe analysis.
Best Conditions
- Timeframe: 1h
- Timeframe: 4h
- Timeframe: daily
- Timeframe: weekly
- Trending markets
- Bull markets
- Breakout environments
- Asset: stocks
- Asset: ETFs
- Asset: forex
- Asset: crypto
Avoid When
- Timeframe: 1m
- Timeframe: 5m
- Bear markets
- High-volatility crash conditions
Confluence Factors
- Resistance level aligns with a round number
- The ascending triangle forms after a flag or pullback pattern
- RSI is between 50-65 (bullish but not overbought)
- The 50 EMA supports the ascending trendline
- Sector or market is also bullish
Scale In Strategy
Enter 50% on the breakout, add 25% on a pullback retest of resistance-turned-support, add final 25% on volume confirmation.
Scale Out Strategy
Take 33% at the measured move target, 33% at 1.618x, trail the remainder.
Risk Management
Volume Analysis
Volume Confirmation
Volume typically contracts as the triangle narrows and should expand significantly on the breakout day.
Volume Profile
Volume should be higher on the up-moves within the triangle and lower on the pullbacks.
Volume Divergence
If volume is higher on the pullbacks than on the rallies to resistance, the pattern may break down instead.
Technical Confluence
Support Resistance
The flat resistance line IS the key level. Once broken, it becomes strong support for the new advance.
Fibonacci Levels
The ascending support line often intersects with Fibonacci retracement levels of the prior move, adding confluence.
Moving Averages
The 20 or 50 EMA often runs along the ascending support line, providing dynamic support within the triangle.
Rsi Confirmation
RSI should remain above 40 during the triangle formation and break above 60 on the breakout.
Macd Confirmation
MACD should show a bullish crossover or rising histogram as the triangle nears its apex.
Bollinger Bands
Bollinger Bands squeeze as the triangle compresses, then expand on the breakout.
Vwap
On intraday triangles, the VWAP often aligns with the ascending support line.
Ichimoku Cloud
Price above the cloud during the triangle formation confirms bullish bias for the breakout.
Elliott Wave
Ascending triangles often form as Wave 4 corrections in Elliott Wave analysis, preceding the final Wave 5 thrust.
Wyckoff Phase
The triangle acts as a re-accumulation structure within the markup phase.
Market Profile
The triangle creates a narrowing value area, and the breakout starts a range extension.
Order Flow
Watch for aggressive market buy orders absorbing the sell orders at resistance — this is the breakout trigger.
Open Interest
In futures, rising open interest during the triangle confirms new position building rather than position liquidation.
Multi-Timeframe Analysis
Higher Timeframe Alignment
The weekly chart should confirm the uptrend. A daily ascending triangle within a weekly uptrend has the highest success rate.
Lower Timeframe Entry
Use the 1-hour chart to see the breakout develop in real-time and time your entry precisely.
Timeframe Confluence
Ideal when a 4-hour ascending triangle breaks out while the daily chart also confirms the uptrend.
Top-Down Approach
Weekly confirms trend → Daily identifies the ascending triangle → 4-hour or 1-hour times the breakout entry.
Statistics
Historical Examples
Netflix Ascending Triangle Breakout
successNetflix formed a textbook ascending triangle with resistance at $560. Higher lows formed over three weeks before the stock broke out on earnings, reaching the measured move target of $590 within days.
Lesson: Ascending triangles ahead of catalysts (like earnings) can produce powerful breakouts. The measured move target was achieved quickly.
Variations
Ascending Triangle with False Breakout
Price briefly breaks above resistance, then pulls back below before making a second, successful breakout.
Ascending Triangle as Reversal
Forms at a bottom after a downtrend rather than as a continuation in an uptrend.
Confusion Matrix
Patterns commonly confused with Bullish Ascending Triangle and how to distinguish them.
Bullish Pennant
6000% similarCheck the resistance line — if it is flat/horizontal, it is an ascending triangle. If it slopes downward, it is a pennant.
Key Differences
- Pennants have converging lines where both slope inward
- Ascending triangles have one flat line (resistance) and one ascending line
Bullish Rectangle Breakout
5000% similarLook at the lows — if they are at the same level, it is a rectangle. If they are rising, it is an ascending triangle.
Key Differences
- Rectangles have both flat support and flat resistance
- Ascending triangles have flat resistance but rising support
The Descending Triangle is a bearish continuation pattern featuring a flat support level with lower highs converging into an apex, typically resolving with a breakdown below the horizontal support as sellers gradually overwhelm buyers.
The Bullish Ascending Channel is a continuation pattern where price trends upward within two parallel trendlines, providing clear buy zones at the lower boundary and profit targets at the upper boundary.
The Bullish Flag is the quintessential continuation pattern: a sharp rally (pole) followed by a brief, tight consolidation (flag) before the next leg up. It represents a healthy pause in a strong uptrend.
The Higher Lows pattern is the most fundamental bullish structure, showing that buyers are willing to step in at progressively higher prices, indicating strengthening demand and a healthy uptrend.
The Bullish Pennant is a continuation pattern featuring a sharp advance (flagpole) followed by a brief triangular consolidation (pennant), before price breaks out and continues higher with a measured move equal to the flagpole.
The Bullish Rectangle Breakout is a continuation pattern where price consolidates between horizontal support and resistance before breaking above the upper boundary to resume the uptrend.
Pro Tips & Common Mistakes
Pro Tips
- The best ascending triangles have at least three touches of resistance and two higher lows
- Breakouts in the final third of the triangle (closer to the apex) tend to be more explosive
- Volume contraction before the breakout is a bullish sign — it shows supply drying up
- Failed breakouts (false breakouts) that quickly reverse back below resistance are powerful short signals
- Measure the target from the widest part of the triangle, not from the breakout point
Common Mistakes
- Entering before the breakout — the pattern can still break downward
- Ignoring volume on the breakout — low-volume breakouts frequently fail
- Setting the target incorrectly by measuring from the wrong point
- Not waiting for a candle close above resistance — intraday spikes often reverse
- Buying too late after the breakout, missing the optimal entry
Advanced Techniques
- Count the number of touches at resistance — the more touches, the weaker the resistance becomes
- Use the volume-weighted average of the triangle to identify the optimal entry zone
- Trade inside the triangle by buying at the ascending trendline and selling at resistance, then hold through the breakout
- Use options strategies: buy calls when the triangle is near the apex for leveraged breakout exposure
Institutional Perspective
Ascending triangles are popular among institutional algorithmic systems because the flat resistance provides a clean, objective breakout level. Institutions often contribute to the higher lows by accumulating shares on pullbacks within the triangle.
Fun Facts
- Thomas Bulkowski's research found that ascending triangles have a 75% upward breakout rate, making them one of the most reliably bullish chart patterns.
- The ascending triangle is the most searched triangle pattern among retail traders, according to Google Trends data.
- The longest-documented ascending triangle lasted over a year on a weekly chart before producing a massive breakout.
Frequently Asked Questions
No. While ascending triangles break upward about 68-75% of the time, they can break downward. A breakdown below the ascending support line is a bearish signal and should be treated with a short or exit. Always wait for confirmation rather than assuming the direction.
Measure the height of the triangle at its widest point (from the flat resistance to the lowest low). Add that distance to the breakout point (the resistance level). This gives you the measured move target. For example, if resistance is at $50 and the lowest low is $42, the target is $50 + $8 = $58.