Overview
Bearish Downside Tasuki Gap
Shita Banare Tasuki
Also known as: Downside Tasuki Gap, Tasuki Gap Bearish
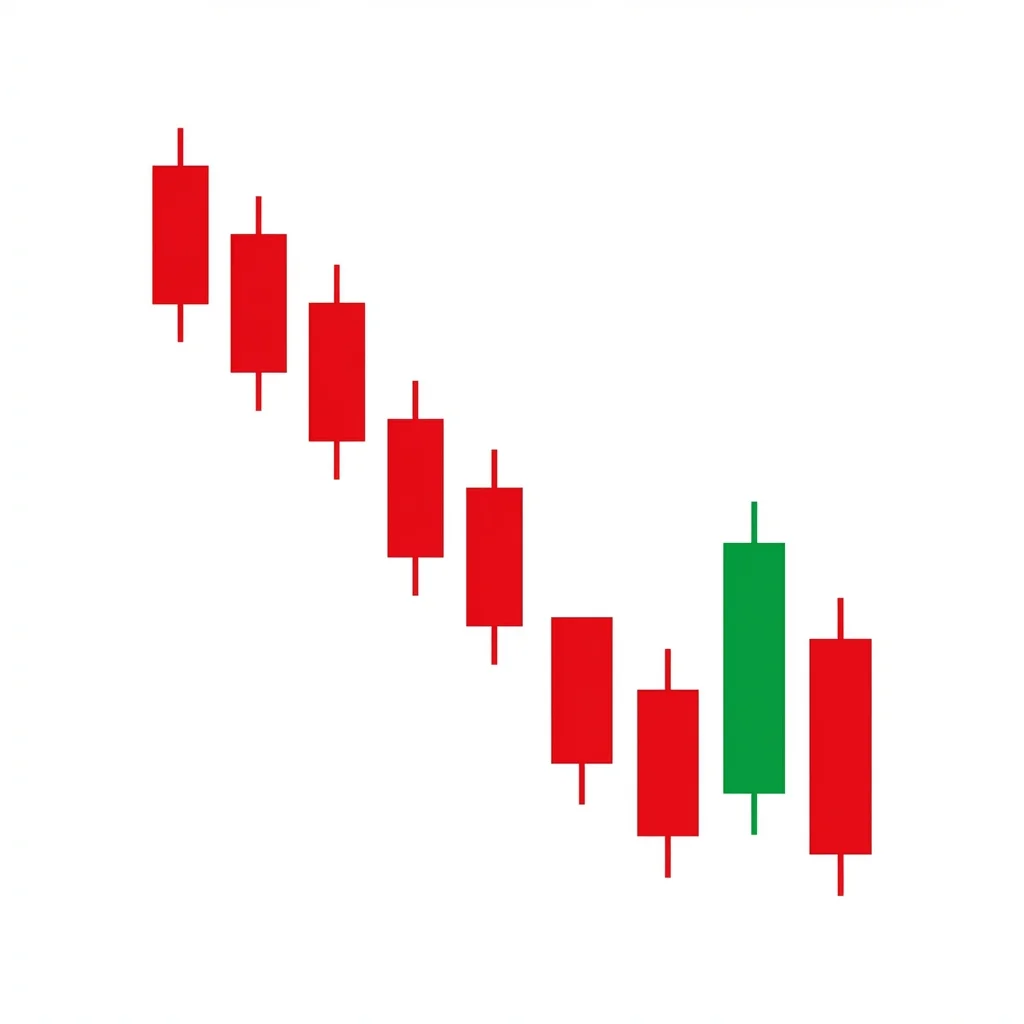
The Downside Tasuki Gap is a bearish continuation pattern in a downtrend where a gap-down is partially but not completely filled by a bullish candle, suggesting that the downtrend will continue as the gap acts as resistance.
The Downside Tasuki Gap is a three-candle bearish continuation pattern. In a downtrend, the first two candles are bearish with a gap between them. The third candle is bullish and partially fills the gap — it opens within the second candle's body and closes higher, into the gap area. Critically, the third candle must NOT completely fill the gap (it must not close above the first candle's low). This partial fill and rejection from the gap area confirms that the gap is acting as resistance and the downtrend should continue. The pattern is the bearish counterpart of the Upside Tasuki Gap. It demonstrates that even when bulls attempt a counter-trend rally, they cannot overcome the gap resistance, and the bears remain in control.
History & Etymology
The Tasuki Gap is a traditional Japanese candlestick pattern named after the cords used to tie back the sleeves of a kimono during work — the 'tasuki.' The pattern name metaphorically suggests the interweaving of candles, like the crossing of the cords. It was used by Japanese rice traders to identify continuation opportunities within trends.
'Tasuki' refers to the cord used in Japan to tie back kimono sleeves, creating a cross-pattern on the back. The pattern's name alludes to the third candle 'crossing' back into the gap area but not passing through — like the cord that crosses but holds in place.
How It Forms
Formation Steps
- 1First candle: bearish candle in a downtrend
- 2Second candle: bearish candle that gaps down from the first candle's close
- 3Third candle: bullish candle that opens within the second candle's body and closes within the gap area — but does NOT fill the gap completely
Prerequisites
- Established downtrend
- A gap down between the first and second candles
- The third candle must open within the second candle's body
- The third candle must close within the gap but NOT above the first candle's low (gap not filled)
Confirmation Signals
- Fourth candle is bearish and continues below the third candle
- The gap remains unfilled
- Volume increases on the continuation
- Price does not retrace above the gap area
Invalidation Signals
- The third candle fills the gap completely (closes above the first candle's low)
- Price continues rising above the gap area
- Strong volume on the bullish third candle
Candle Breakdown
First Bearish Candle
A bearish candle continuing the downtrend.
Sellers maintain control. The downtrend continues normally.
Gap-Down Bearish Candle
A bearish candle that opens below the first candle's close, creating a gap down.
The gap down accelerates the decline. Sellers are aggressive. The gap creates a window of unsupported prices above.
Bullish Tasuki Candle
A bullish candle that opens within the second candle's body and partially fills the gap, but does not close above the first candle's low.
Bulls attempt a counter-trend rally. They push into the gap but are rejected. The gap acts as resistance, confirming that the supply zone holds.
Psychology
The Tasuki Gap reveals that gaps in a downtrend act as supply zones. When bulls attempt to fill the gap and fail, it confirms that sellers are waiting at those levels to push price back down.
Buyer Perspective
Buyers see the gap as overextended and attempt to fade it. Their rally succeeds partially but is stopped by the gap resistance. This failure demoralizes further buying attempts.
Seller Perspective
Sellers view the partial gap fill as an opportunity to sell at better prices. The third candle's failure to fill the gap confirms that their selling pressure is dominant.
Smart Money Action
Smart money placed sell orders in the gap area, knowing that retail traders would attempt to fade the gap. The third candle's failure at these orders confirms institutional selling dominance.
Retail Trader Trap
Retail traders who buy the third candle expecting a gap fill are trapped when the gap holds as resistance.
Emotional Cycle
Trading Strategy
Aggressive Entry
Short at the close of the third candle once the gap fill failure is confirmed.
Conservative Entry
Short when the fourth candle breaks below the third candle's low.
The most recent swing low below the pattern.
The gap size projected below the second candle's low.
Major support below.
Best Conditions
- Timeframe: daily
- Timeframe: 4h
- established downtrend
- bear market
- after a gap-down event
- Asset: stocks
- Asset: futures
- Asset: forex
Avoid When
- Timeframe: 1m
- Timeframe: 5m
- oversold bounce conditions
- near major support
Confluence Factors
- The gap aligns with a prior support-turned-resistance level
- Low volume on the third candle
- RSI remains below 50
- The broader trend is strongly bearish
- Other bearish patterns confirm the downtrend
Scale In Strategy
Enter 50% at third candle close, add 50% on break of third candle's low.
Scale Out Strategy
Take 50% at first support, trail the rest.
Risk Management
Volume Analysis
Volume Confirmation
Low volume on the third (bullish) candle confirms the rally was weak.
Volume Profile
Average, high, low volume across the three candles is ideal.
Volume Divergence
Low volume on the gap fill attempt confirms lack of buying conviction.
Technical Confluence
Support Resistance
The gap area becomes a resistance zone. The third candle's failure there confirms the resistance.
Fibonacci Levels
The gap area may align with a Fibonacci retracement level, adding confluence to the resistance.
Moving Averages
If the gap area contains a declining moving average, the resistance is strengthened.
Rsi Confirmation
RSI remaining below 50 during the third candle confirms the bearish trend.
Macd Confirmation
MACD below zero with the third candle not triggering a bullish crossover confirms continuation.
Bollinger Bands
The third candle bouncing from the lower band toward the middle band but failing to reach it is consistent with the pattern.
Vwap
The third candle failing to close above VWAP confirms seller dominance.
Ichimoku Cloud
Price below the cloud with the third candle failing to enter the cloud confirms the downtrend.
Elliott Wave
The pattern commonly occurs during Wave 3 (the strongest impulsive wave) of a bearish impulse.
Wyckoff Phase
Aligns with the markdown phase where brief rallies are absorbed by supply.
Market Profile
The gap corresponds to a single print area in the market profile — a zone of rapid price movement with low volume.
Order Flow
The third candle shows passive selling absorbing active buying in the gap area.
Open Interest
Stable or rising OI during the pattern confirms that existing short positions are maintained.
Multi-Timeframe Analysis
Higher Timeframe Alignment
A daily Tasuki Gap in a weekly downtrend confirms continuation.
Lower Timeframe Entry
After the daily pattern, use the 4H chart for entry on the fourth candle.
Timeframe Confluence
The pattern is most relevant on daily charts where gaps are meaningful.
Top-Down Approach
Weekly: downtrend. Daily: Tasuki Gap confirms. 4H: entry timing.
Statistics
Historical Examples
Nikkei 225 Downside Tasuki Gap
successThe Nikkei gapped down from 28,000 to 27,600, then a bullish candle rallied into the gap to 27,850 but failed to close above 28,000 (the first candle's low). The decline resumed to 25,700 over the next month.
Lesson: The gap acting as resistance is the critical element. The unfilled gap confirmed sellers were waiting at those levels.
Variations
Near-Fill Tasuki Gap
The third candle nearly fills the gap (closes within 10% of filling it).
Confusion Matrix
Patterns commonly confused with Bearish Downside Tasuki Gap and how to distinguish them.
Bearish Falling Three Methods
5000% similarIf there is a gap between the first two bearish candles, it is a Tasuki Gap. If the small candles are contained within a single large candle's range, it is Falling Three Methods.
Key Differences
- Falling Three Methods has a consolidation within two bearish candles
- Tasuki Gap specifically involves a gap and partial gap fill
- Falling Three Methods does not require a gap
The Downtrend is the most fundamental bearish pattern — a persistent series of lower highs and lower lows demonstrating that sellers consistently overwhelm buyers at progressively lower price levels.
A falling window is a Japanese candlestick term for a gap down in price where the high of the current candle is below the low of the previous candle, signaling strong bearish continuation momentum.
The Bearish Abandoned Baby is one of the rarest and most reliable top reversal patterns in candlestick analysis. It features a doji that is completely isolated by gaps on both sides, signaling an abrupt and dramatic shift from buying to selling pressure.
The Bearish Advance Block shows three consecutive bullish candles with progressively smaller bodies and longer upper shadows, signaling that buying momentum is weakening and a reversal or consolidation is likely.
The Deliberation pattern shows two strong bullish candles followed by a small-bodied third candle, indicating that the uptrend is 'deliberating' — the bulls have stalled and are uncertain about pushing higher.
The Evening Doji Star is a top-tier three-candle bearish reversal pattern. The doji in the star position represents the pivot point between bullish confidence (first candle) and bearish dominance (third candle), making it one of the most reliable reversal signals in candlestick analysis.
Pro Tips & Common Mistakes
Pro Tips
- The key rule: the gap must NOT be filled. If the third candle closes above the first candle's low, the pattern is invalid.
- The wider the gap between the first two candles, the more significant the pattern when the fill attempt fails.
- This pattern is best used as confirmation to stay in an existing short position rather than as a standalone entry signal.
- In stocks, gaps are common on daily charts. In forex (24-hour market), gaps are rare — the pattern is less applicable.
Common Mistakes
- Accepting a pattern where the gap is completely filled — this invalidates the Tasuki Gap.
- Trading the pattern in isolation without confirming the broader downtrend.
- Confusing any three candles with a gap for a Tasuki Gap — the specific structure matters.
- Ignoring volume on the third candle — high volume on the gap fill attempt suggests buyers are serious.
Advanced Techniques
- Use the gap area as a future resistance zone. If price retests the gap in a future rally, it often acts as resistance again.
- Combine with order flow analysis to see if passive selling absorbed the third candle's rally into the gap.
- The Tasuki Gap can be used as a filter for adding to existing short positions within a trend.
Institutional Perspective
Institutional traders place sell limit orders in gap areas, knowing that gaps act as supply zones. The Tasuki Gap's third candle reveals that these orders are being hit, confirming the gap as institutional resistance.
Fun Facts
- The 'tasuki' is a cord technique still used in Japanese traditional arts and martial arts to keep kimono sleeves out of the way during physical activity.
- The Tasuki Gap is one of the few candlestick patterns that specifically addresses gap behavior, making it uniquely relevant in markets with daily gaps.
Frequently Asked Questions
Three conditions: (1) there must be a gap down between the first two bearish candles, (2) the third candle must be bullish and open within the second candle's body, (3) the third candle must close within the gap but NOT fill it completely.
If the third candle closes above the first candle's low (completely filling the gap), the pattern is invalid. A filled gap suggests buyers have enough strength to overcome the supply zone.