Overview
Bearish Downtrend
Also known as: Downtrend, Bear Trend, Lower Highs Lower Lows, Bearish Trend
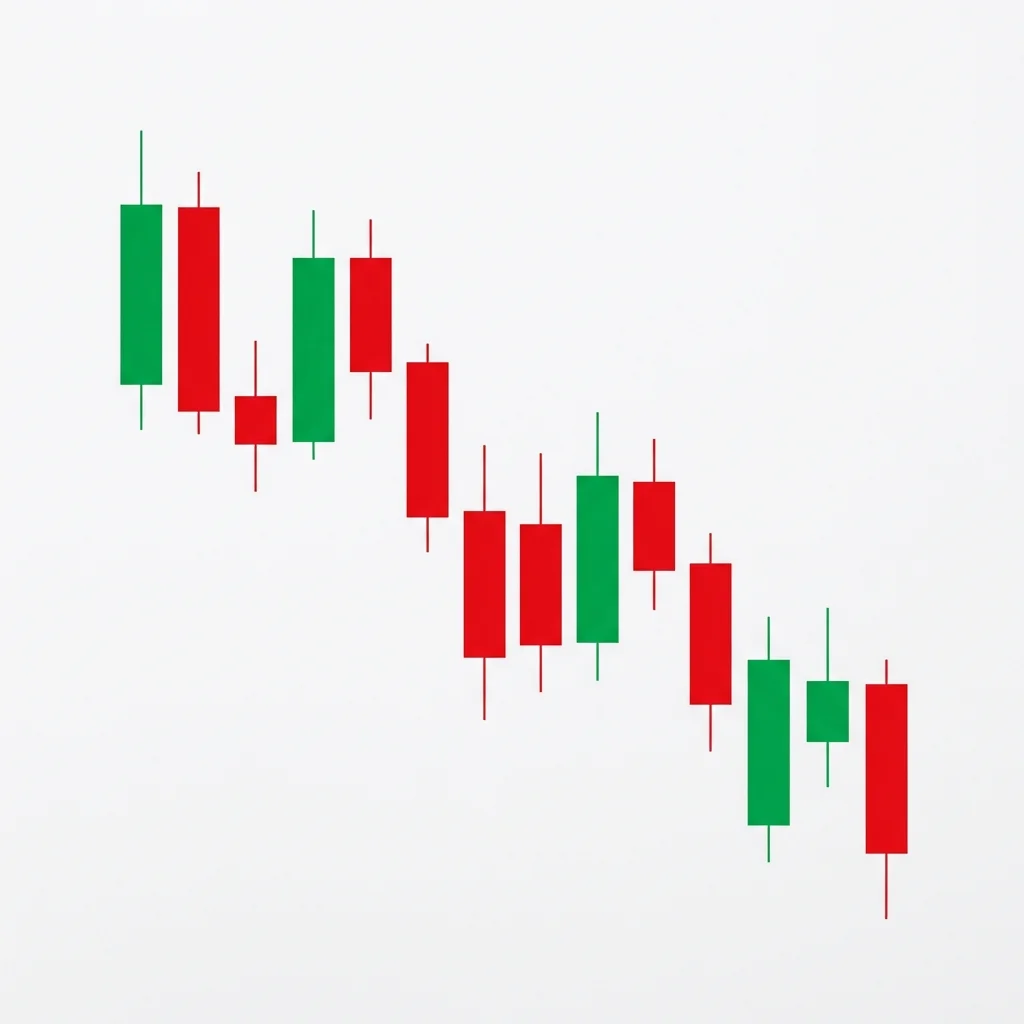
The Downtrend is the most fundamental bearish pattern — a persistent series of lower highs and lower lows demonstrating that sellers consistently overwhelm buyers at progressively lower price levels.
A downtrend is defined by a series of lower highs and lower lows. It is the most basic and important bearish pattern in technical analysis because it represents the fundamental state of a bearish market. All other bearish patterns either occur within a downtrend (continuation patterns) or signal the beginning of one (reversal patterns). Understanding the downtrend is prerequisite knowledge for all bearish pattern analysis. A downtrend is established when price makes at least two lower highs and two lower lows. It is confirmed by declining moving averages and volume behavior (higher volume on declines, lower on rallies). The trend continues until price makes a higher high or higher low, signaling a potential reversal. Charles Dow's famous dictum — 'the trend is your friend' — applies directly: trading with the downtrend has a statistical edge over trading against it.
History & Etymology
The concept of a trend is the oldest and most fundamental idea in technical analysis. Charles Dow articulated trend theory in his editorials for the Wall Street Journal in the late 1800s. His observation that markets move in trends — primary, secondary, and minor — formed the basis of what became known as Dow Theory, which remains the foundation of technical analysis today.
The term 'downtrend' simply describes the direction of the trend: down. 'Trend' comes from the Middle English 'trenden' meaning 'to revolve' or 'to turn,' which evolved to mean a general direction of movement.
How It Forms
Formation Steps
- 1A series of lower highs — each swing high is lower than the previous
- 2A series of lower lows — each swing low is lower than the previous
- 3Price trends below declining moving averages (20, 50, 200 EMA)
- 4Trendline connecting lower highs slopes downward
Prerequisites
- At least two lower highs and two lower lows to confirm the trend
- Price below the 20 and 50-period moving averages
- The trend must be identifiable on the chosen timeframe
Confirmation Signals
- Consistent lower highs and lower lows
- Moving averages are declining and properly ordered (20 below 50 below 200)
- Volume is higher on declines than on rallies
- RSI staying below 60 on rallies
Invalidation Signals
- A higher high forms (breaking the trendline)
- Price closes above the 50-period moving average
- Volume increases on rallies and decreases on declines
Candle Breakdown
Lower High
A swing high that is lower than the previous swing high, defining the resistance trendline.
Buyers attempt a rally but sellers step in at a lower level than before. Each lower high shows sellers are more aggressive.
Lower Low
A swing low that breaks below the previous swing low, confirming the downtrend.
Sellers push through previous support. Each new low confirms the downtrend and demoralizes buyers.
Psychology
A downtrend reflects a sustained consensus that prices should be lower. Sellers are consistently more aggressive than buyers, willing to sell at progressively lower prices.
Buyer Perspective
Buyers attempt counter-trend rallies that fail at progressively lower levels. Each failed rally erodes their confidence and reduces the size of subsequent buying attempts.
Seller Perspective
Sellers gain confidence with each lower high and lower low. The consistent pattern gives them a framework: sell on rallies and add on new lows.
Smart Money Action
Institutions use the downtrend structure to systematically add to short positions on each rally to the declining trendline.
Retail Trader Trap
Retail traders repeatedly try to 'buy the dip' in a downtrend, catching falling knives. Each lower high punishes this behavior.
Emotional Cycle
Trading Strategy
Aggressive Entry
Short on any rally to a declining moving average (10 or 20 EMA) or trendline.
Conservative Entry
Short on a break below the most recent swing low.
The most recent swing low.
A measured move equal to the last swing's range.
Major historical support levels.
Best Conditions
- Timeframe: daily
- Timeframe: weekly
- Timeframe: 4h
- Timeframe: 1h
- bear market
- sector rotation out
- fundamental deterioration
- Asset: stocks
- Asset: indices
- Asset: forex
- Asset: crypto
- Asset: commodities
Avoid When
- Timeframe: 1m
- strong bull market momentum
Confluence Factors
- Moving averages are properly ordered bearish (20 < 50 < 200)
- RSI consistently below 60
- ADX above 25 (trending, not ranging)
- Volume confirms (higher on declines)
- Fundamentals support the decline
Scale In Strategy
Add to shorts on each rally to the declining 20 EMA or trendline.
Scale Out Strategy
Take partial profits at each new swing low. Trail the rest with the 20 EMA.
Risk Management
Volume Analysis
Volume Confirmation
Volume should increase on declines and decrease on rallies. This confirms seller dominance.
Volume Profile
Healthy downtrends have higher volume on impulse waves (down) than corrective waves (up).
Volume Divergence
If volume starts increasing on rallies, the trend may be weakening.
Technical Confluence
Support Resistance
In a downtrend, each lower high becomes resistance. Previous support levels, once broken, become resistance.
Fibonacci Levels
Rallies within a downtrend typically retrace 38.2% to 50% before the trend resumes. Use these levels for entry.
Moving Averages
The 20 EMA acts as dynamic resistance in a downtrend. The 50 and 200 MAs are further resistance levels. The Death Cross (50 below 200) confirms the trend.
Rsi Confirmation
RSI staying below 60 on rallies and making new lows on declines confirms the trend. RSI above 50 only during corrective rallies.
Macd Confirmation
MACD below zero with bearish crossovers confirms the downtrend. MACD making new lows with price confirms momentum.
Bollinger Bands
Price tends to ride the lower Bollinger Band during strong downtrends. Rallies to the middle band are selling opportunities.
Vwap
Price consistently closing below VWAP confirms institutional selling pressure.
Ichimoku Cloud
Price below all Ichimoku lines and below the cloud is the strongest bearish confirmation.
Elliott Wave
Downtrends consist of five-wave impulses and three-wave corrections (ABC). The impulse waves (1, 3, 5) move with the trend.
Wyckoff Phase
The downtrend is the Markdown phase in the Wyckoff cycle, following Distribution.
Market Profile
Value migrates lower over time. Each day's value area is lower than the previous.
Order Flow
Cumulative delta declining confirms that sellers are consistently more aggressive.
Open Interest
Rising OI during the decline confirms new shorts are being established.
Multi-Timeframe Analysis
Higher Timeframe Alignment
A daily downtrend within a weekly downtrend is the strongest configuration for trend-following trades.
Lower Timeframe Entry
Use the 4H or 1H chart to time entries on rallies within the daily downtrend.
Timeframe Confluence
All timeframes aligned bearish (daily, weekly, monthly) creates a 'trifecta' setup.
Top-Down Approach
Monthly: confirm bear trend. Weekly: identify the trend phase. Daily: find entry points. 4H: refine timing.
Statistics
Historical Examples
S&P 500 Downtrend 2022
successThe S&P 500 entered a clear downtrend in January 2022, making consistent lower highs and lower lows throughout the year. The 20 EMA acted as reliable resistance on every rally. The trend produced a 27% decline from peak to trough.
Lesson: Trading with the trend (short on rallies to the 20 EMA) was consistently profitable. Fighting the trend by buying dips was consistently punished.
Variations
Steep Downtrend
An aggressive downtrend with sharp declines and minimal rallies. Price stays below the 10 EMA.
Grinding Downtrend
A slow, steady decline with small candles and minimal volatility.
Confusion Matrix
Patterns commonly confused with Bearish Downtrend and how to distinguish them.
Bearish Descending Channel
8000% similarIf the lower highs and lower lows fit within parallel trendlines, it is a Descending Channel. If the trend is less orderly, it is simply a Downtrend.
Key Differences
- A channel has clearly defined parallel trendlines
- A downtrend may or may not fit within parallel lines
- A channel is a specific type of downtrend with defined boundaries
The Descending Channel is a chart formation where price trends lower within two parallel downward-sloping trendlines, making consistent lower highs and lower lows in an orderly bearish progression.
Bearish lower highs is a fundamental trend structure pattern where each successive swing high forms at a lower level, confirming bearish momentum and a downtrend. It is the most basic and important bearish market structure signal.
The Broadening Top (Megaphone) is a chart formation characterized by expanding price swings that create higher highs and lower lows, reflecting increasing volatility and instability at market tops before a bearish breakdown.
The Descending Triangle is a bearish continuation pattern featuring a flat support level with lower highs converging into an apex, typically resolving with a breakdown below the horizontal support as sellers gradually overwhelm buyers.
The Diamond Top is a rare reversal pattern that forms at market peaks, consisting of a broadening formation followed by a contracting formation, creating a diamond shape that signals a shift from expansion to contraction and ultimately a bearish breakdown.
The Double Top Breakdown is the confirmed version of the Double Top — the precise moment when price breaks below the neckline, triggering the measured move decline. This is the actionable event that converts the pattern from potential to confirmed.
Pro Tips & Common Mistakes
Pro Tips
- The trend is your friend. In a downtrend, the default position should be short or flat — never long.
- Use the 20 EMA as your dynamic resistance for entries. Rallies that fail at the 20 EMA are the bread and butter of trend trading.
- The trend continues until it does not. Do not try to predict the reversal — trade what you see.
- A downtrend ends with a higher high (break of the trendline). Until that happens, respect the trend.
- The strongest downtrends have the 20 EMA below the 50 EMA below the 200 EMA — this is called perfect bearish alignment.
Common Mistakes
- Trying to buy the bottom in a downtrend (catching a falling knife).
- Shorting after an extended move without waiting for a pullback (chasing).
- Confusing a counter-trend rally with a trend reversal. One higher low does not end a trend — wait for a higher high.
- Not respecting the trend because 'the price seems too low.' Price can always go lower in a downtrend.
Advanced Techniques
- Use the ADX to measure trend strength. ADX above 25 = trending. ADX above 40 = strong trend. ADX below 20 = no trend.
- Combine trend identification with Elliott Wave counts to estimate where you are in the trend (Wave 3 is strongest, Wave 5 exhausts).
- Use the anchored VWAP from the swing high to define the institutional average entry. Price staying below this VWAP confirms institutional selling.
Institutional Perspective
Institutional trend followers use systematic models to identify and trade downtrends. They add to shorts on each corrective rally and reduce on each new low. The consistency of their selling creates the very trend structure they are trading.
Fun Facts
- Charles Dow's observation that 'the trend is your friend' is over 120 years old and remains the single most important principle in technical analysis.
- Studies show that trend-following strategies have been profitable across all major asset classes and all major time periods in recorded market history.
- The average bear market (downtrend in a major index) lasts about 9.6 months and declines approximately 33%.
Frequently Asked Questions
A downtrend ends when price makes a higher high — that is, when price breaks above the most recent lower high. Some traders wait for both a higher high AND a higher low for full confirmation. Until this happens, the trend is assumed to continue.
Generally no. Trying to pick bottoms in downtrends (catching a falling knife) is one of the most common and costly trading mistakes. Wait for the trend to reverse (higher high/higher low) before considering long positions.