Overview
Bearish Outside Reversal
Also known as: Outside Day Down, Bearish Outside Bar, Bearish Key Reversal Bar
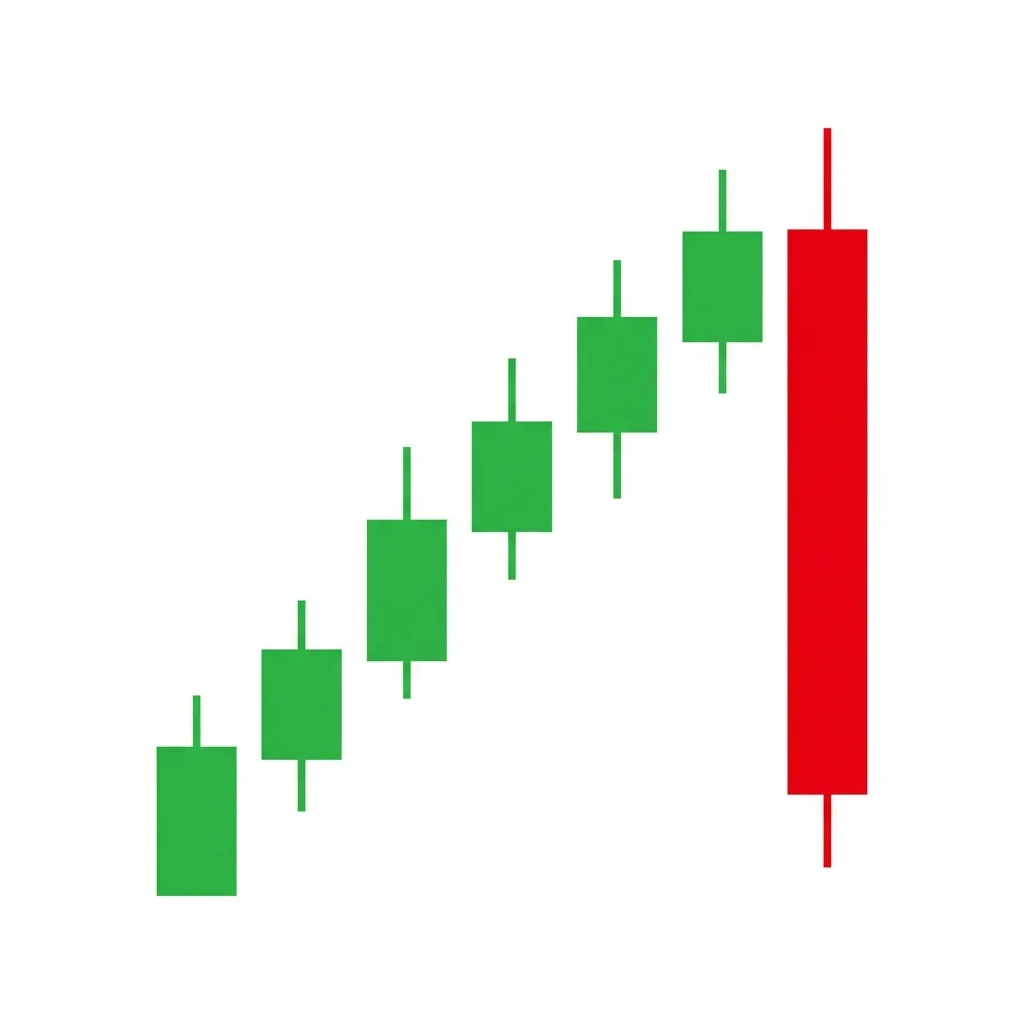
A bearish outside reversal occurs when a candle's range completely engulfs the prior candle's entire range (highs and lows), closing near its low. It signals that sellers have overwhelmed buyers and a reversal is likely.
The bearish outside reversal is one of the most powerful two-candle reversal patterns. Unlike a standard bearish engulfing which only requires the body to engulf the prior body, the outside reversal demands that the entire range—including the shadows—of the first candle is consumed by the second. This makes it a stronger signal because it shows that sellers not only overcame the prior candle's body but also exceeded its extreme points. The pattern is especially significant when it occurs at resistance levels, after extended uptrends, or on high volume. Many institutional traders consider this pattern a reliable short-term reversal signal, particularly on daily and weekly charts.
History & Etymology
The outside reversal pattern has been recognized in Western technical analysis since the early days of bar charting in the mid-20th century. It predates Japanese candlestick analysis becoming popular in the West and was one of the key patterns described by early technicians like Edwards and Magee in their seminal work 'Technical Analysis of Stock Trends'.
The name 'outside' refers to the second candle being 'outside' of the first candle's range, meaning it makes both a higher high and a lower low. 'Reversal' indicates the pattern signals a change in trend direction from bullish to bearish.
How It Forms
Formation Steps
- 1First candle is relatively small, either bullish or bearish
- 2Second candle opens above the first candle's high
- 3Second candle closes below the first candle's low
- 4The second candle's range completely engulfs the first candle's entire range (including wicks)
Prerequisites
- Established uptrend preceding the pattern
- The market should be near a resistance level or overbought condition
Confirmation Signals
- Third candle closes below the outside bar's low
- Volume on the outside bar is significantly higher than average
- RSI divergence at the top
Invalidation Signals
- Price closes above the outside bar's high
- Lack of follow-through selling after the pattern
- Volume dries up on the outside bar
Candle Breakdown
Inside Candle
A relatively small candle that sets the range to be engulfed. Its size relative to the outside bar highlights the shift in momentum.
Represents the last gasp of bullish complacency before the reversal. Buyers are still present but losing conviction.
Outside Bar
A large bearish candle that opens above the first candle's high and closes below the first candle's low, completely engulfing the entire range.
Sellers take complete control. The fact that they pushed price both above and below the prior range shows total dominance.
Psychology
The outside reversal reflects a dramatic shift in market sentiment within a single session. Buyers initially push price higher, but sellers overwhelm them and drive price to new lows.
Buyer Perspective
Buyers feel confident early in the session as price makes new highs, but panic sets in as selling pressure reverses all gains and pushes below the prior session's low.
Seller Perspective
Sellers sense exhaustion in the uptrend and aggressively enter short positions. The ability to push price below the prior bar's low gives them confidence that the tide has turned.
Smart Money Action
Institutional sellers use the higher open as an opportunity to enter large short positions at premium prices, absorbing retail buying before reversing the market.
Retail Trader Trap
Retail traders buy the breakout above the prior high, only to watch their positions go underwater as price reverses sharply.
Emotional Cycle
Trading Strategy
Aggressive Entry
Enter short at the close of the outside bar, especially if it closes near its low.
Conservative Entry
Wait for the next candle to break below the outside bar's low before entering short.
1:1 risk-reward ratio measured from entry to stop
Next significant support level or demand zone
Measured move equal to the height of the outside bar
Best Conditions
- Timeframe: 1D
- Timeframe: 1W
- Timeframe: 4h
- After extended uptrends
- At major resistance levels
- During earnings season
- Asset: Stocks
- Asset: Indices
- Asset: Forex
Avoid When
- Timeframe: 1m
- Timeframe: 5m
- Timeframe: 15m
- Choppy sideways markets
- Low-volume holiday periods
Confluence Factors
- Forms at a major resistance level
- RSI overbought divergence
- 200 SMA or EMA nearby acting as resistance
- Fibonacci extension level alignment
- High volume on the outside bar
Scale In Strategy
Add to the position on a pullback to the midpoint of the outside bar if it holds as resistance.
Scale Out Strategy
Exit 50% at 1:1 risk-reward, trail the rest with a moving average.
Risk Management
Volume Analysis
Volume Confirmation
The outside bar should have at least 50% more volume than the average of the prior 20 bars.
Volume Profile
Heaviest volume should occur in the lower third of the outside bar, confirming aggressive selling.
Volume Divergence
If the outside bar forms on declining volume, treat it with skepticism—true reversals require conviction.
Technical Confluence
Support Resistance
Most powerful when the outside bar forms at a well-established resistance level, confirming sellers defend that zone.
Fibonacci Levels
Look for outside reversals forming at the 127.2% or 161.8% Fibonacci extension levels of prior swings.
Moving Averages
An outside reversal at the 50 or 200 SMA/EMA is particularly significant on higher timeframes.
Rsi Confirmation
RSI above 70 with bearish divergence adds strong confirmation to the reversal signal.
Macd Confirmation
A MACD histogram turning negative as the outside bar forms suggests momentum is shifting bearish.
Bollinger Bands
An outside reversal that opens above the upper Bollinger Band and closes back inside suggests exhaustion.
Vwap
An outside reversal that opens above VWAP and closes below it confirms intraday sentiment shift.
Ichimoku Cloud
An outside reversal below the Kumo cloud adds bearish confluence.
Elliott Wave
Often appears at the end of Wave 5 or Wave C completions, marking major turning points.
Wyckoff Phase
Can signal the LPSY (Last Point of Supply) in a Wyckoff distribution schematic.
Market Profile
The outside bar often represents a failed auction above value, with price rotating back into the prior value area.
Order Flow
Delta turning heavily negative (more market sells than buys) during the outside bar confirms institutional selling.
Open Interest
Monitor open interest changes for additional confirmation of institutional participation in the move.
Multi-Timeframe Analysis
Higher Timeframe Alignment
A daily outside reversal is strongest when the weekly chart also shows resistance or overbought conditions.
Lower Timeframe Entry
On a 4H chart, the daily outside reversal often shows a head and shoulders or double top pattern forming within the bar.
Timeframe Confluence
When a 4H outside reversal aligns with a daily bearish candle and a weekly resistance level, the probability of follow-through increases significantly.
Top-Down Approach
Identify weekly resistance, look for daily outside reversals at that level, and use the 4H chart for precise entry timing.
Statistics
Historical Examples
Apple Weekly Outside Reversal
successApple formed a weekly outside reversal at its all-time high near $182, with volume 80% above average. The stock declined 28% over the following six months.
Lesson: Weekly outside reversals at all-time highs with massive volume are among the most reliable bearish signals available.
EUR/USD Daily Outside Reversal at Resistance
successEUR/USD formed a bearish outside reversal at the 1.1275 resistance level, which had held for months. Price declined over 400 pips in the following weeks.
Lesson: Outside reversals at established horizontal resistance levels are high-probability setups, especially in forex.
Variations
Opening Range Outside Reversal
An outside reversal that forms within the first hour of trading, combining the pattern with opening range breakout failure.
Gap-Up Outside Reversal
The outside bar gaps up significantly before reversing to close below the prior bar's low.
Confusion Matrix
Patterns commonly confused with Bearish Outside Reversal and how to distinguish them.
Bearish Engulfing
8500% similarCheck if the second candle's high is above the first candle's high AND the second candle's low is below the first candle's low. If both are true, it is an outside reversal, not just an engulfing.
Key Differences
- Engulfing only requires the body to engulf the prior body
- Outside reversal requires the entire range (wicks included) to be engulfed
- Outside reversal is a stronger signal due to the total range dominance
Bearish Key Reversal
7500% similarA key reversal focuses on the close relative to the prior close. An outside reversal focuses on the range engulfment. A pattern can be both simultaneously.
Key Differences
- Key reversal requires a new high followed by a close below the prior close
- Outside reversal requires total range engulfment
- Key reversal may not engulf the full range
The Bearish Engulfing is one of the most powerful and commonly traded two-candle reversal patterns. A large bearish candle completely engulfs the prior bullish candle, demonstrating a decisive shift from buying to selling dominance.
The bearish key reversal is a powerful single-bar reversal pattern where price makes a new high then reverses to close below the prior bar's low on high volume, signaling a decisive shift from buying to selling control.
The bearish marubozu is a single candle with no shadows — price opened at the high and closed at the low, showing complete seller domination throughout the entire session with no buying resistance.
A bearish reversal is the comprehensive transition from an uptrend to a downtrend, marked by a failure to make a new higher high, the formation of a lower high, and a break below the last higher low. It represents a fundamental shift in market sentiment from bullish to bearish.
Three black crows is a powerful bearish reversal pattern consisting of three consecutive long bearish candles, each opening within the prior candle's body and closing near its low. It signals strong, persistent selling pressure and a likely trend reversal.
The Bullish Outside Reversal is a two-bar pattern where the second bar has a wider range than the first, trading both below its low and above its high before closing bullish. This dramatic range expansion signals a powerful shift from bearish to bullish control.
Pro Tips & Common Mistakes
Pro Tips
- The larger the outside bar relative to recent candles, the more significant the reversal signal.
- Outside reversals on weekly charts are rare but incredibly powerful—treat them as major trend change signals.
- If the outside bar closes in its lower 25%, the follow-through is typically stronger.
- Combine with volume analysis: the outside bar should be the highest volume bar in at least 10 periods.
- In stocks, outside reversals on earnings days carry extra significance due to the fundamental catalyst.
Common Mistakes
- Confusing a standard bearish engulfing with an outside reversal—check the wicks, not just the bodies
- Trading outside reversals in choppy, sideways markets where they lose their significance
- Setting stop losses too tight on large outside bars—use the full range for the stop
- Ignoring the volume component—low-volume outside bars are unreliable
- Not waiting for confirmation when the outside bar forms in an unclear trend
Advanced Techniques
- Use the midpoint of the outside bar as a key level: price holding below it confirms bearish intent, while a reclaim suggests the pattern may fail.
- On intraday charts, look for the outside bar to form during the opening range breakout failure for a powerful reversal setup.
- Combine outside reversals with options strategies—buy puts at the close of the outside bar for leveraged exposure.
- In futures markets, check the commitment of traders (COT) report for net-short positioning by commercials to confirm the reversal.
Institutional Perspective
Institutional traders often create outside reversals by executing large sell programs that begin after the open gap up. The initial push above the prior high triggers retail breakout buyers, providing the liquidity institutions need to fill their sell orders.
Fun Facts
- The outside reversal is called an 'outside day' in bar chart terminology because the range of the day is 'outside' (wider than) the prior day.
- Some studies show that outside reversals on Mondays after gap-up opens have a higher success rate than any other day of the week.
- In the 1987 Black Monday crash, the Dow formed a massive outside reversal on the weekly chart that signaled the bottom.
Frequently Asked Questions
A bearish engulfing only requires the second candle's body to engulf the first candle's body. A bearish outside reversal requires the second candle's entire range (including wicks) to engulf the first candle's entire range. The outside reversal is a stronger signal.
With proper context (uptrend, resistance level, high volume), the bearish outside reversal has an approximate 65% win rate. It is one of the more reliable two-candle reversal patterns, especially on daily and weekly charts.
Place your stop loss above the high of the outside bar. Since these bars can be large, consider reducing position size to maintain your standard risk percentage per trade.