Overview
Bearish Market Structure Break
Also known as: MSB, Break of Structure, BOS Down, Trend Structure Break
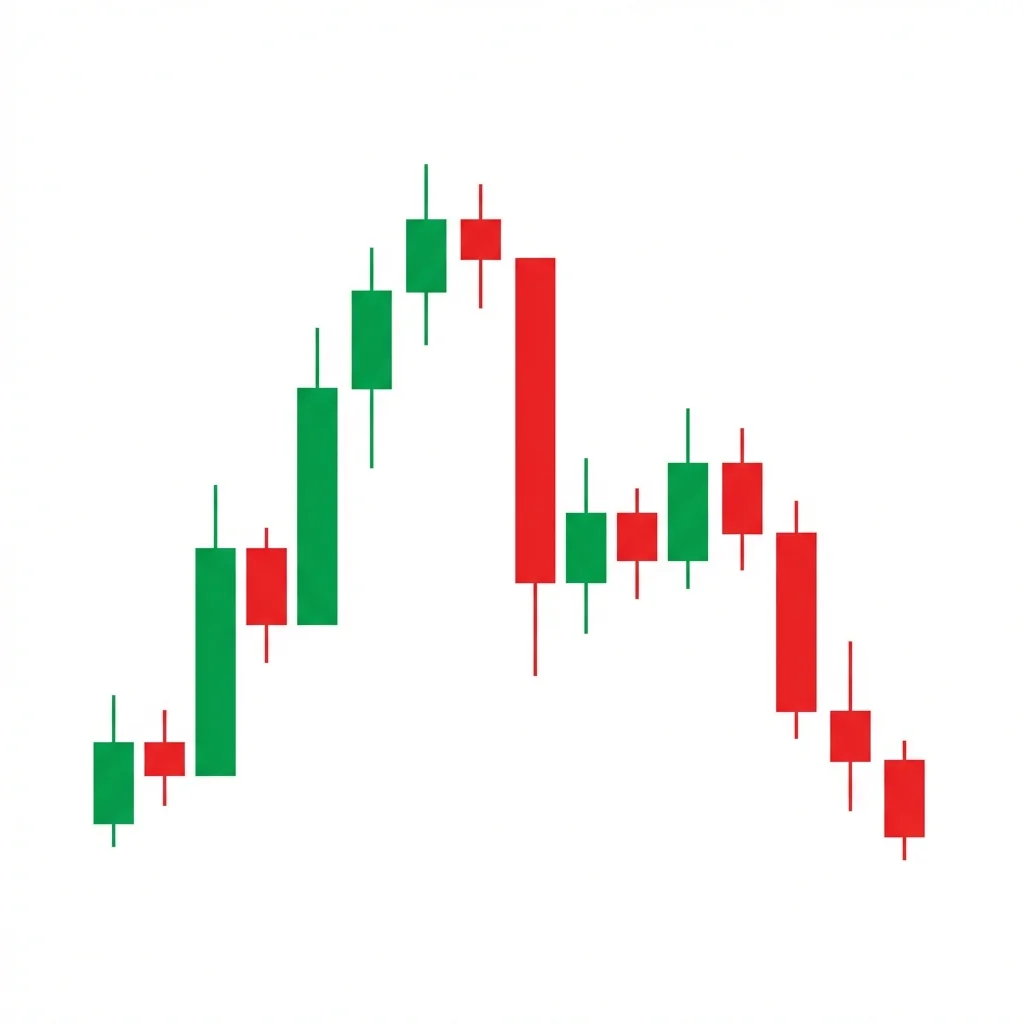
A bearish market structure break occurs when price in an uptrend breaks below a prior swing low, invalidating the series of higher highs and higher lows that defined the uptrend. It signals a potential trend reversal from bullish to bearish.
The market structure break (MSB) is a cornerstone concept in smart money and ICT (Inner Circle Trader) methodology. An uptrend is defined by higher highs and higher lows. When price breaks below a significant swing low, it creates a lower low — breaking the bullish structure. This is the earliest and most definitive signal that the trend may be reversing. The MSB concept is favored by institutional and smart money traders because it provides a clear, objective signal without relying on lagging indicators. The break must be decisive — a brief wick below the swing low that immediately recovers is not a valid MSB.
History & Etymology
Market structure analysis has roots in Dow Theory but has been modernized by smart money concept (SMC) traders and popularized by ICT methodology in the 2010s and 2020s. The concept of break of structure (BOS) has become one of the most widely discussed topics in modern retail trading education.
'Market structure' refers to the pattern of swing highs and swing lows that define a trend. A 'break' occurs when this structure is violated — specifically when a lower low forms in an uptrend, 'breaking' the bullish structure.
How It Forms
Formation Steps
- 1Existing uptrend with higher highs and higher lows
- 2Price makes a swing high (potential final high)
- 3Price declines below the most recent swing low
- 4This break of the swing low invalidates the uptrend structure
- 5Confirmation when price fails to reclaim the broken level
Prerequisites
- Clear uptrend with defined swing points
- A swing low that has been respected at least once
Confirmation Signals
- Close below the most recent significant swing low
- Volume expands on the break
- Failed retest of the broken swing low from below
Invalidation Signals
- Price immediately reclaims above the broken swing low
- No follow-through selling
- New higher high after the break
Candle Breakdown
Final Higher High
The last swing high in the uptrend before the reversal begins.
May show signs of exhaustion — divergence, volume decline, rejection patterns.
Decline Phase
Candles declining from the final high toward the prior swing low.
Selling pressure builds. This decline is stronger than previous pullbacks.
Structure Break Candle
The candle that closes below the prior swing low, officially breaking the market structure.
The decisive moment — the uptrend is officially invalidated. All traders monitoring structure see this break.
Psychology
The MSB is the moment when the market officially transitions from bullish to bearish structure. It is the point where the 'innocent until proven guilty' presumption of the uptrend is reversed.
Buyer Perspective
Buyers who relied on the uptrend structure face the reality that the trend has changed. Many capitulate at the MSB, adding to the selling pressure.
Seller Perspective
Sellers receive the definitive signal they have been waiting for. The MSB gives them permission to short with the trend rather than against it.
Smart Money Action
Institutions engineer the MSB by selling aggressively enough to break the key swing low. The break triggers retail stops, providing liquidity for further institutional selling.
Retail Trader Trap
Retail traders with buy orders at the swing low (expecting support) are stopped out by the MSB. Their liquidation fuels the initial decline.
Emotional Cycle
Trading Strategy
Aggressive Entry
Short immediately on the close below the swing low.
Conservative Entry
Wait for a retest of the broken swing low from below (similar to last kiss), then enter on rejection.
Next significant support level below.
Measured move: distance from the final high to the broken swing low, projected downward.
Prior major support or demand zone.
Best Conditions
- Timeframe: daily
- Timeframe: 4h
- Timeframe: 1h
- Timeframe: 15m
- end of uptrend
- distribution phase
- sector weakness
- Asset: stocks
- Asset: forex
- Asset: indices
- Asset: crypto
Avoid When
- Timeframe: 1m
- strong bull market
- early uptrend
Confluence Factors
- MSB occurs at a higher timeframe resistance
- Volume expansion on the break
- Fair value gap forms on the break
- Order block above for retest entry
- Liquidity sweep before the MSB
Scale In Strategy
Enter 50% on the break, add 50% on the retest of the broken level.
Scale Out Strategy
Take 33% at the next support, 33% at the measured move, trail rest.
Risk Management
Volume Analysis
Volume Confirmation
Volume should expand on the structure break candle, confirming conviction behind the move.
Volume Profile
The broken swing low area shows concentration of prior buying — its failure is significant.
Volume Divergence
If volume is low on the break, it may be a false break — wait for confirmation.
Technical Confluence
Support Resistance
The broken swing low becomes the key resistance level on any retest. This is the polarity principle in market structure form.
Fibonacci Levels
The retest of the broken swing low often aligns with the 50-61.8% retracement of the break leg.
Moving Averages
MSB occurring below the 20 and 50 EMA confirms the structural change aligns with trend-following signals.
Rsi Confirmation
RSI breaking below 50 during the MSB confirms the momentum shift from bullish to bearish.
Macd Confirmation
MACD crossing bearish around the MSB confirms the momentum behind the structural change.
Bollinger Bands
MSB through the lower Bollinger Band shows the break is significant.
Vwap
Breaking below anchored VWAP from the trend start confirms the structural shift.
Ichimoku Cloud
MSB below the Kumo cloud confirms the trend change on Ichimoku analysis.
Elliott Wave
The MSB often occurs at the start of Wave C or a new impulsive Wave 1 down.
Wyckoff Phase
The MSB corresponds to the sign of weakness (SOW) or the 'jump across the creek' in the markdown phase.
Market Profile
The swing low breakout moves value area lower, confirming acceptance of lower prices.
Order Flow
Aggressive selling absorbing passive buying at the swing low. Delta turning strongly negative.
Open Interest
Rising open interest on the break confirms new short positions being initiated.
Multi-Timeframe Analysis
Higher Timeframe Alignment
MSB on the daily aligned with weekly bearish structure is the strongest setup.
Lower Timeframe Entry
Use 15m or 1H to enter at the order block or FVG after the daily MSB.
Timeframe Confluence
MSB on both 4H and daily confirms the structural change.
Top-Down Approach
Weekly bearish bias → Daily MSB → 4H retest of broken level → 1H entry.
Statistics
Historical Examples
SPY MSB January 2022
successSPY broke below its December 2021 swing low, creating a bearish MSB that ended the bull market. The structure change preceded the 2022 bear market.
Lesson: MSB on the daily chart of a major index is a significant event that can mark the start of a bear market.
BTC/USD MSB May 2022
successBitcoin broke below a key 4H swing low at $37,500, creating a bearish MSB. The decline continued to $26K before a bounce.
Lesson: MSB in crypto on the 4H timeframe provides actionable swing trade entries.
Variations
Clean MSB
A single strong candle breaks and closes below the swing low.
Gradual MSB
Multiple candles erode and eventually close below the swing low.
Confusion Matrix
Patterns commonly confused with Bearish Market Structure Break and how to distinguish them.
Bearish Lower Highs
70% similarThe MSB is the moment when the first lower low forms, breaking the uptrend structure. Lower highs is the ongoing pattern of declining swing highs that typically follows.
Key Differences
- MSB is a specific event (the break); lower highs is a structural pattern
- MSB is the first lower low; lower highs can exist before the first MSB
- MSB is a single trigger; lower highs is a trend condition
The Double Top is an M-shaped reversal pattern where price tests a resistance level twice and fails, creating two peaks at similar levels. The breakdown below the neckline (trough between peaks) confirms the reversal with a measured move target equal to the pattern height.
The head and shoulders is the most well-known reversal pattern in technical analysis. It consists of three peaks — a higher middle peak (head) flanked by two lower peaks (shoulders) — and signals a major bearish reversal when the neckline breaks.
Bearish lower highs is a fundamental trend structure pattern where each successive swing high forms at a lower level, confirming bearish momentum and a downtrend. It is the most basic and important bearish market structure signal.
A bearish order block is the last bullish candle before a significant bearish displacement, representing an area where institutional sellers placed large sell orders. When price returns to this zone, it often reverses downward as unfilled orders are executed.
A Bullish Market Structure Break (MSB/BOS) occurs when price in a downtrend breaks above the most recent swing high, signaling that the series of lower highs has ended and a potential trend reversal is underway.
The bearish power of three (PO3) is a smart money concept describing a three-phase intraday process: accumulation (consolidation), manipulation (false breakout above the range), and distribution (sharp reversal downward). It represents how institutions engineer liquidity to fill sell orders.
Pro Tips & Common Mistakes
Pro Tips
- Not all swing low breaks are equal — the swing low must be significant (respected at least once) for the MSB to be valid.
- A close below the swing low is more significant than a wick below — closes confirm the break.
- The retest of the broken swing low provides the best risk-reward entry in MSB trading.
- Combine MSB with smart money concepts: look for fair value gaps and order blocks formed during the break.
Common Mistakes
- Treating every minor swing low break as an MSB — the swing low must be a significant level.
- Not waiting for the candle to close below the swing low — wicks below are not confirmed breaks.
- Entering without a plan for false breaks — use stops above the broken level.
- Ignoring higher timeframe context — a lower timeframe MSB within a higher timeframe uptrend is less significant.
Advanced Techniques
- Use the MSB as the anchor for smart money concept analysis: identify the fair value gap, order block, and liquidity zones created by the break.
- Combine with ICT concepts: look for an MSB preceded by a liquidity sweep above the recent high (buy-side liquidity grab).
- Use multi-timeframe MSB analysis: a 4H MSB confirmed by a daily MSB is the strongest signal.
- Monitor the displacement candle on the MSB — the stronger the break candle, the more valid the structure change.
Institutional Perspective
The MSB is the single most important concept in institutional market structure analysis. It represents the definitive change in the order flow regime from buy-dominant to sell-dominant.
Fun Facts
- The market structure break has become one of the most discussed concepts in trading education since 2020, driven by social media and ICT methodology.
- The concept is essentially Charles Dow's 130-year-old definition of a trend change, repackaged for the modern era.
- Smart money concept trading, built around the MSB, has become the dominant retail trading methodology in forex and crypto markets.
Frequently Asked Questions
A market structure break (MSB) occurs when price breaks below a prior swing low in an uptrend, creating the first lower low and invalidating the bullish trend structure.
In SMC, the MSB is the primary signal for trend reversal. After the MSB, traders look for retests of the broken level, fair value gaps, and order blocks for optimal entry points.
MSBs are valid on all timeframes. Higher timeframe MSBs (daily, weekly) are more significant. Most SMC traders use 4H MSBs with 15m entries.