Overview
Bullish Market Structure Break
Also known as: Bullish BOS, Break of Structure, MSB Long, Bullish CHoCH
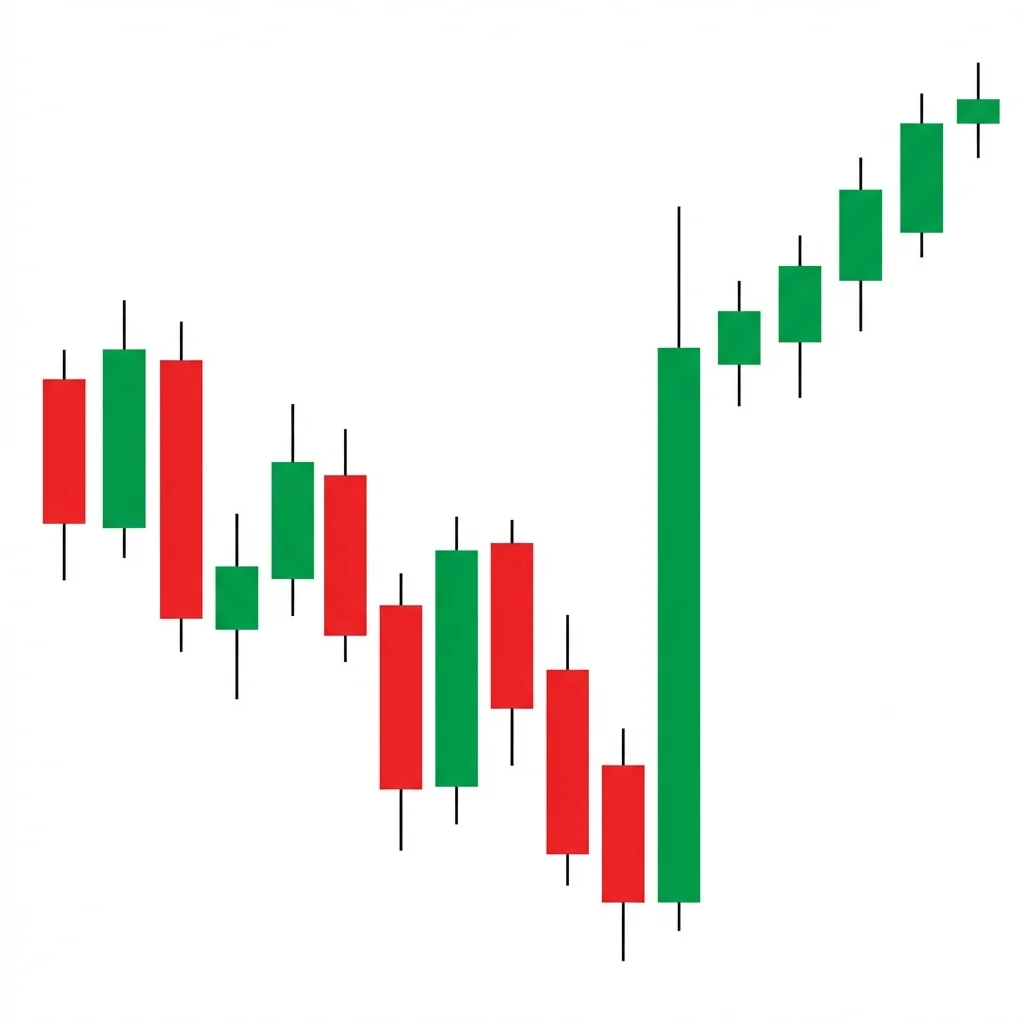
A Bullish Market Structure Break (MSB/BOS) occurs when price in a downtrend breaks above the most recent swing high, signaling that the series of lower highs has ended and a potential trend reversal is underway.
The Market Structure Break is a core concept in Smart Money Concepts (SMC) and ICT methodology. In a downtrend, price makes consecutive lower lows and lower highs. A bullish MSB occurs when price breaks above the most recent significant swing high, creating the first higher high. This breaks the bearish structure and signals that institutional order flow has shifted from selling to buying. Some traders distinguish between a Break of Structure (BOS) and a Change of Character (CHoCH) — the CHoCH is the very first break that changes the trend direction, while BOS refers to continuation breaks within the new trend.
History & Etymology
The Market Structure Break concept has its roots in Dow Theory (trends defined by higher highs/higher lows or lower lows/lower highs) but was formalized in the Smart Money Concepts framework popularized by ICT (Inner Circle Trader) methodology in the 2010s-2020s. It has become one of the most widely taught concepts in modern retail trading education.
'Market structure' refers to the pattern of swing highs and swing lows that define a trend. A 'break' of this structure means the trend's defining pattern has been violated, suggesting a change in direction.
How It Forms
Formation Steps
- 1A downtrend of lower lows and lower highs is established
- 2Price makes a swing low
- 3Price rallies and breaks above the most recent swing high (lower high)
- 4This break of the swing high signals the first higher high and thus a change in structure
Prerequisites
- Clear downtrend with identifiable lower lows and lower highs
- A definable swing high that serves as the structural reference
- Price closes above that swing high
Confirmation Signals
- Price closes above the swing high (not just a wick)
- Volume increases on the breakout candle
- A subsequent higher low forms after the break
Invalidation Signals
- Price fails to close above the swing high
- The swing high break is immediately reversed
- A new lower low forms after the break attempt
Candle Breakdown
Swing Low
The most recent swing low in the downtrend from which the reversal begins
This may be a liquidity sweep or spring where smart money accumulates.
Structure Break Candle
The candle that closes above the most recent swing high, breaking the bearish structure
The decisive break above the swing high confirms the shift in institutional order flow from selling to buying.
Psychology
The MSB signals that the balance of power has shifted from bears to bulls. The inability of sellers to make a new lower high means their control over the trend has ended.
Buyer Perspective
Buyers see the break above the swing high as confirmation that the tide has turned. They begin entering positions with confidence that the bearish structure is broken.
Seller Perspective
Sellers who expected the lower-high pattern to continue are caught off guard. Their stops above the swing high are triggered, fueling the breakout.
Smart Money Action
Smart money accumulates during the final push lower (often with a liquidity grab below the swing low), then drives price above the swing high to trigger retail stops and shift the visible market structure.
Retail Trader Trap
Retail traders who are short with stops above the swing high are stopped out by the MSB. Those who recognized the downtrend 'too late' are now buying the reversal too late.
Emotional Cycle
Trading Strategy
Aggressive Entry
Enter long as soon as a candle closes above the swing high.
Conservative Entry
Wait for the first pullback after the MSB (the first higher low) and enter on the bounce.
The next significant resistance level or swing high from the prior range.
2:1 R:R or the next premium zone.
The origin of the prior downtrend move.
Best Conditions
- Timeframe: 15m
- Timeframe: 1h
- Timeframe: 4h
- Timeframe: daily
- trend reversal
- after liquidity grab
- at HTF support
- Asset: forex
- Asset: indices
- Asset: crypto
- Asset: stocks
Avoid When
- Timeframe: 1m
- choppy sideways markets
- news-driven volatility
- extremely illiquid markets
Confluence Factors
- Higher-timeframe support at the swing low
- Order block below the swing low
- Liquidity sweep before the break
- Fair value gap created by the break candle
- Bullish divergence on RSI
Scale In Strategy
Enter 50% on the MSB, add 50% on the first higher-low pullback.
Scale Out Strategy
Take partials at each resistance level, trail the remainder.
Risk Management
Volume Analysis
Volume Confirmation
Higher volume on the break above the swing high confirms institutional participation.
Volume Profile
Volume climax at the swing low (accumulation) followed by strong volume on the break.
Volume Divergence
Low volume on the break may indicate a false structural break.
Technical Confluence
Support Resistance
The swing high being broken becomes the new support level for the pullback entry.
Fibonacci Levels
The pullback after the MSB often retraces to the 50% or 61.8% OTE (Optimal Trade Entry) zone.
Moving Averages
A cross above the 20 or 50-period MA often accompanies the MSB.
Rsi Confirmation
RSI breaking above 50 from below confirms the shift in momentum.
Macd Confirmation
MACD bullish crossover aligning with the MSB strengthens the signal.
Bollinger Bands
The break above the middle band often coincides with the MSB.
Vwap
Reclaiming VWAP on lower timeframes confirms the structure shift.
Ichimoku Cloud
Breaking above the Tenkan-sen during the MSB is an early confirmation.
Elliott Wave
The MSB often corresponds to the start of a new impulse wave (Wave 1).
Wyckoff Phase
The MSB aligns with the sign of strength (SOS) in Wyckoff accumulation.
Market Profile
The break above a prior balance area confirms the structural shift.
Order Flow
Aggressive buying dominating the tape at the swing high break confirms the MSB.
Open Interest
Rising OI on the break confirms new long positioning.
Multi-Timeframe Analysis
Higher Timeframe Alignment
A 4H MSB at a daily support level is the ideal setup.
Lower Timeframe Entry
After a 4H MSB, use the 15M chart to find the order block pullback entry.
Timeframe Confluence
MSBs confirmed across multiple timeframes are extremely powerful trend change signals.
Top-Down Approach
Identify daily/weekly bias, look for 4H MSB at key levels, enter on 15M/1H pullback to order block.
Statistics
Historical Examples
EUR/USD Bullish MSB
successEUR/USD was in a clear downtrend with lower lows and lower highs. After sweeping liquidity below 1.0520, price rallied and broke above the 1.0560 swing high, confirming the MSB. The pair rallied to 1.0720.
Lesson: MSBs following liquidity sweeps are the highest-probability setups in SMC trading.
Bitcoin Structure Shift
successBitcoin broke above the $27,500 swing high after weeks of lower highs, confirming a bullish MSB that preceded the rally to $35,000+.
Lesson: Multi-week MSBs on higher timeframes produce significant trend changes.
Variations
Change of Character (CHoCH)
The very first break of structure that reverses the trend — the initial signal.
Break of Structure (BOS)
A continuation break in the already-established new trend direction.
Confusion Matrix
Patterns commonly confused with Bullish Market Structure Break and how to distinguish them.
Bullish Higher Lows
7500% similarMSB is a discrete event (breaking above a specific swing high). Higher lows are a gradual trend characteristic.
Key Differences
- Higher lows describe gradual trend structure; MSB is a specific structural break event
- MSB focuses on the break of a swing high, not just the formation of higher lows
A bearish market structure break occurs when price in an uptrend breaks below a prior swing low, invalidating the series of higher highs and higher lows that defined the uptrend. It signals a potential trend reversal from bullish to bearish.
The Bullish Engulfing is one of the most popular and reliable two-candle reversal patterns. A large bullish candle completely engulfs the prior bearish candle body, signaling a decisive shift from selling to buying control.
The Bullish Fair Value Gap (FVG) is a smart money concept identifying price imbalances where aggressive buying creates a gap between the first candle high and third candle low. Price often returns to this zone to fill the inefficiency before continuing higher.
The Higher Lows pattern is the most fundamental bullish structure, showing that buyers are willing to step in at progressively higher prices, indicating strengthening demand and a healthy uptrend.
The Inverse Head and Shoulders is one of the most reliable bullish reversal patterns, featuring three troughs with the middle one (head) being the deepest, signaling a major transition from a downtrend to an uptrend.
A Bullish Order Block is the last bearish candle before a strong upside displacement. It marks where institutional buying occurred, and when price returns to this zone, it often bounces as institutions defend their entry level.
Pro Tips & Common Mistakes
Pro Tips
- The MSB is most powerful when preceded by a liquidity sweep below the most recent swing low
- Wait for a candle CLOSE above the swing high — wicks above don't count as confirmed breaks
- The first pullback after the MSB (creating the first higher low) is often the best entry
- Combine with order blocks and fair value gaps for a complete SMC trading setup
- Higher-timeframe MSBs carry more weight than lower-timeframe ones
Common Mistakes
- Treating every wick above a swing high as an MSB — the close must be above
- Not waiting for the pullback and entering at extended prices after the break
- Ignoring higher-timeframe context — a lower-timeframe MSB against a higher-timeframe downtrend often fails
- Not identifying the correct swing high to use as the structural reference
- Over-trading MSBs on very low timeframes where they produce many false signals
Advanced Techniques
- Combine the MSB with a breaker block entry for a high-probability pullback trade
- Use multi-timeframe analysis: wait for a daily MSB, then trade the 1H pullback to an order block
- Map the MSB to Wyckoff phases for deeper understanding of institutional behavior
- Use the fair value gap created by the break candle as a target zone for the pullback
Institutional Perspective
The MSB is the visible expression of institutional order flow shift. When price breaks structure, it means institutional buying has overwhelmed selling. The pullback to the break level is where institutions add to positions, knowing the structural shift is confirmed.
Fun Facts
- The Market Structure Break is the most discussed concept in Smart Money trading communities, with millions of YouTube views on the topic.
- While SMC popularized the terminology, the underlying concept is identical to Dow Theory's definition of trend changes from the 1890s.
- ICT (Inner Circle Trader) Michael Huddleston is widely credited with formalizing MSB/BOS concepts for retail traders.
Frequently Asked Questions
A Market Structure Break (MSB) occurs when price breaks above the most recent swing high in a downtrend, signaling that the series of lower highs has ended and a potential trend reversal is underway.
CHoCH (Change of Character) is the FIRST break that reverses the trend. BOS (Break of Structure) refers to subsequent breaks in the same direction that confirm trend continuation.