Overview
Bearish Order Block
Also known as: Supply Zone, Institutional Sell Zone, OB Short
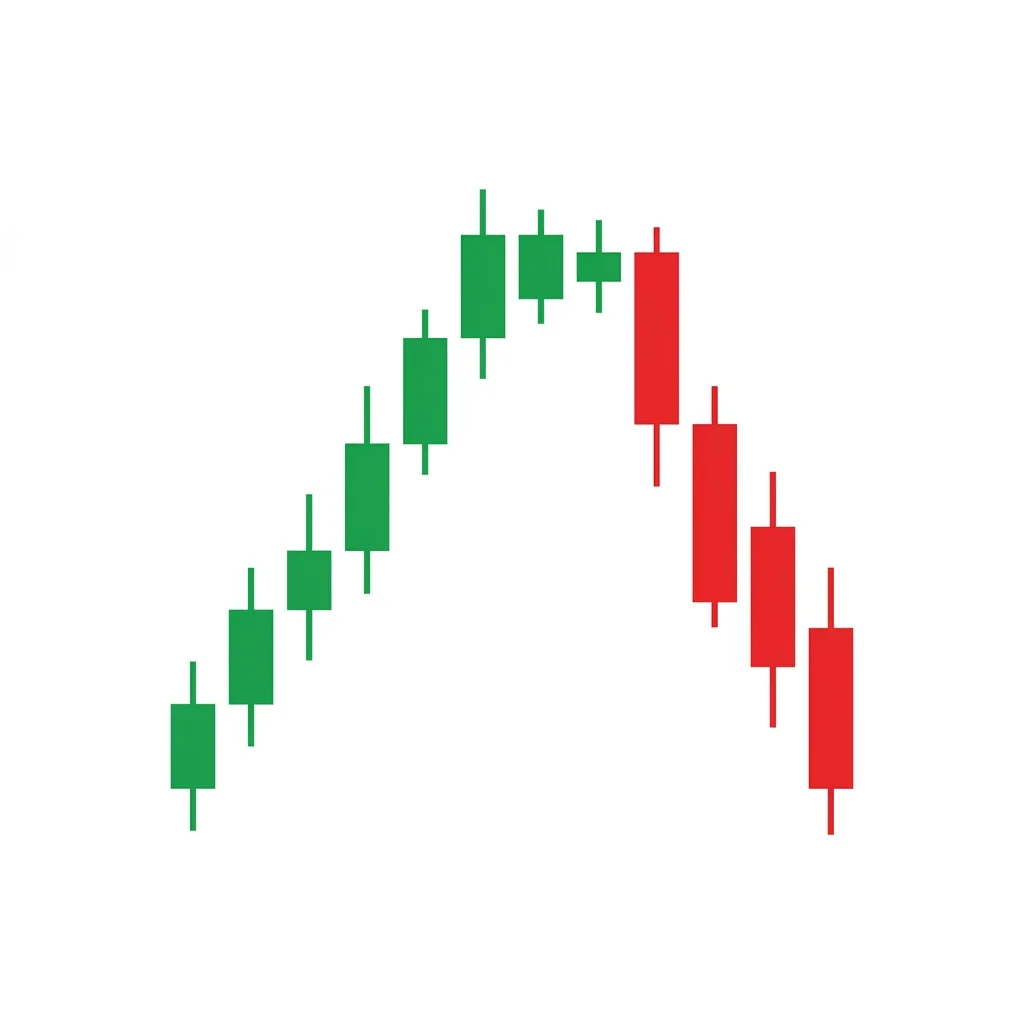
A bearish order block is the last bullish candle before a significant bearish displacement, representing an area where institutional sellers placed large sell orders. When price returns to this zone, it often reverses downward as unfilled orders are executed.
The bearish order block is a core concept in smart money trading methodology. It identifies zones on the chart where institutional participants—banks, hedge funds, and large-scale traders—have placed significant sell orders. These zones are identified by locating the last up-close candle before a strong downward move that breaks market structure. The theory is that institutions cannot fill their entire position in one go due to liquidity constraints, so they leave unfilled orders at these levels. When price retraces to the order block, those remaining sell orders get triggered, causing price to reverse. Traders use order blocks to find high-probability short entries with tight stop losses placed just above the order block zone.
History & Etymology
Order block theory originated from inner-circle trader (ICT) methodology developed by Michael Huddleston in the 2010s. The concept draws on the idea that institutional order flow leaves footprints on the chart that retail traders can identify. It gained massive popularity through social media and YouTube trading communities in the 2020s, becoming one of the most widely discussed smart money concepts.
The term 'order block' refers to a 'block' of institutional orders placed at a specific price level. 'Bearish' indicates these are sell orders that push price lower when triggered.
How It Forms
Formation Steps
- 1Identify the last bullish candle before a strong bearish move
- 2Mark the high and open of that bullish candle as the order block zone
- 3Wait for price to retrace back into the order block zone
- 4Look for bearish rejection within the zone
Prerequisites
- Prior uptrend or rally into a premium zone
- Strong impulsive bearish move away from the zone
- Break of market structure to the downside
Confirmation Signals
- Price re-enters the order block zone and rejects
- Bearish engulfing or pin bar within the zone
- Volume spike on the rejection candle
- Lower timeframe break of structure within the zone
Invalidation Signals
- Price closes above the order block zone with conviction
- Multiple candles closing above the zone
- Strong bullish momentum through the zone
Candle Breakdown
Last Bullish Candle
The final up-close candle before the bearish displacement. This candle represents the zone where institutional sell orders were placed.
Retail traders are still buying here, providing the liquidity institutions need to fill their sell orders.
Displacement Candle
A strong bearish candle that breaks structure and moves aggressively away from the order block zone.
Institutional selling overwhelms the market, creating a clear imbalance between supply and demand.
Continuation Candle
A follow-through bearish candle confirming the displacement was driven by genuine institutional intent, not a stop hunt.
The market fully commits to the downside, confirming that smart money is distributing.
Psychology
Bearish order blocks exploit the liquidity mismatch between institutional and retail traders. Institutions sell into retail buying pressure, creating zones that act as future resistance.
Buyer Perspective
Retail buyers see the initial bullish candle as a sign of continued upward momentum, unaware that institutions are using their buy orders as exit liquidity for large short positions.
Seller Perspective
Institutional sellers deliberately push price into areas of retail buy-side liquidity. They cannot fill their entire position at once, so residual sell orders remain at the order block level.
Smart Money Action
Smart money places large sell orders within the order block zone, deliberately triggering retail stop losses below to generate additional sell-side pressure.
Retail Trader Trap
Retail traders buy the pullback to the order block zone expecting a continuation, only to get stopped out as institutional sell orders trigger.
Emotional Cycle
Trading Strategy
Aggressive Entry
Enter short with a limit order at the bottom of the order block zone, anticipating rejection without waiting for confirmation.
Conservative Entry
Wait for price to enter the order block zone, then enter short after a bearish engulfing candle or a lower-timeframe break of structure.
Previous swing low or nearest demand zone
Next significant order block on the buy side
Full measured move equal to the displacement leg
Best Conditions
- Timeframe: 1h
- Timeframe: 4h
- Timeframe: 1D
- Trending
- Post-news volatility
- London/New York session overlaps
- Asset: Forex
- Asset: Indices
- Asset: Crypto
Avoid When
- Timeframe: 1m
- Timeframe: 5m
- Low-volatility ranging markets
- Holiday-thinned liquidity
Confluence Factors
- Fair value gap within the order block zone
- Fibonacci 61.8-79% retracement level
- Breaker block alignment
- Liquidity sweep above the order block before rejection
- Bearish divergence on RSI or MACD
Scale In Strategy
Add to the position if price sweeps above the order block and then shows rejection, using the new high as the adjusted stop loss.
Scale Out Strategy
Take 50% off at the first swing low, move stop to breakeven, and let the remainder ride to the full target.
Risk Management
Volume Analysis
Volume Confirmation
Look for volume increase during the displacement and volume spike on the rejection candle within the order block.
Volume Profile
Volume profile should show a low-volume node at the order block level, indicating price moved through quickly the first time.
Volume Divergence
Decreasing volume on the pullback to the order block suggests weak buyers, supporting the bearish thesis.
Technical Confluence
Support Resistance
Order blocks act as refined supply zones. They often align with traditional horizontal resistance levels, adding confluence.
Fibonacci Levels
The most reliable order blocks sit between the 61.8% and 79% Fibonacci retracement levels of the displacement move, known as the optimal trade entry (OTE) zone.
Moving Averages
Price rejection at an order block that coincides with the 200 EMA or 50 SMA adds significant confluence for a short entry.
Rsi Confirmation
RSI overbought readings (above 70) as price enters the order block zone support the bearish case.
Macd Confirmation
A bearish MACD crossover or histogram divergence as price tests the order block strengthens the signal.
Bollinger Bands
Price touching or exceeding the upper Bollinger Band while in an order block zone suggests overextension and a likely reversal.
Vwap
An order block positioned above VWAP indicates price is at a premium, supporting the short thesis.
Ichimoku Cloud
An order block below the Kumo cloud on the higher timeframe suggests alignment with the broader bearish trend.
Elliott Wave
Order blocks often form at the end of Wave 2 or Wave B corrections in a bearish impulse sequence.
Wyckoff Phase
Bearish order blocks frequently form during the UTAD (Upthrust After Distribution) phase of Wyckoff distribution.
Market Profile
Order blocks often align with value area high (VAH) levels, where price is statistically likely to reverse.
Order Flow
Institutional order flow data often shows significant sell-side resting orders at the order block level, confirming the zone.
Open Interest
Rising open interest at the order block level confirms institutional activity and increases the probability of a reaction.
Multi-Timeframe Analysis
Higher Timeframe Alignment
Identify the bearish order block on the daily or weekly chart first to confirm the macro direction is bearish.
Lower Timeframe Entry
Drop to the 15-minute or 5-minute chart to find a precise entry within the higher-timeframe order block zone.
Timeframe Confluence
The strongest setups occur when a 4H order block aligns with a daily order block zone, creating a 'nested' institutional supply area.
Top-Down Approach
Start with the weekly to determine trend, use the daily to identify the order block, and use the 1H or 15M for entry timing.
Statistics
Historical Examples
EUR/USD Bearish Order Block at 1.1275
successPrice formed a bearish order block at 1.1275 after a strong displacement candle broke the recent swing low. On the retest, price wicked into the order block and dropped 150 pips over the next two days.
Lesson: Order blocks on the 4H timeframe in forex majors tend to produce clean reactions, especially during London and New York sessions.
S&P 500 Order Block Failure
failureA daily bearish order block formed during a correction, but the broader trend was bullish. Price sliced through the order block on strong volume and continued higher.
Lesson: Never trade order blocks against the higher-timeframe trend. Always confirm with multi-timeframe analysis.
BTC Bearish Order Block at $69,000
successBitcoin formed a massive bearish order block near its all-time high. When price failed to push through, the displacement was historic—BTC dropped to $15,500 over the next year.
Lesson: High-timeframe order blocks on major assets can lead to massive moves. The larger the timeframe, the more significant the reaction.
Variations
Refined Order Block
Using a lower timeframe to identify the exact candle within the order block zone for a tighter entry.
Breaker Block
A failed order block that gets swept and then acts as a support/resistance flip zone.
Propulsion Block
An order block followed by a fair value gap, indicating extreme institutional selling pressure.
Confusion Matrix
Patterns commonly confused with Bearish Order Block and how to distinguish them.
Bearish Supply Zone
8000% similarAn order block is always the last bullish candle before displacement; a supply zone is a general area of selling pressure.
Key Differences
- Supply zones are broader and defined by S/R levels; order blocks are specific candles
- Order blocks require a displacement move; supply zones do not
- Order blocks are a smart money concept; supply zones are classical TA
Bearish Resistance Rejection
6000% similarOrder blocks require a clear displacement and market structure break after the bullish candle, while resistance rejection is simply price bouncing off a horizontal level.
Key Differences
- Resistance is a horizontal level; an order block is a candle-defined zone
- Order blocks have a specific formation criteria involving displacement
- Resistance is reactive; order blocks are proactive institutional footprints
The Distribution phase is a Wyckoff concept where institutional investors systematically sell (distribute) their holdings to the public within a trading range at a market top, before the subsequent markdown (decline) begins.
A bearish market structure break occurs when price in an uptrend breaks below a prior swing low, invalidating the series of higher highs and higher lows that defined the uptrend. It signals a potential trend reversal from bullish to bearish.
A bearish resistance rejection occurs when price rallies into a well-established resistance level and is met with selling pressure, producing bearish candles with long upper wicks. The repeated failure to break through resistance signals a reversal.
A Bullish Order Block is the last bearish candle before a strong upside displacement. It marks where institutional buying occurred, and when price returns to this zone, it often bounces as institutions defend their entry level.
The bearish power of three (PO3) is a smart money concept describing a three-phase intraday process: accumulation (consolidation), manipulation (false breakout above the range), and distribution (sharp reversal downward). It represents how institutions engineer liquidity to fill sell orders.
The Bullish Fair Value Gap (FVG) is a smart money concept identifying price imbalances where aggressive buying creates a gap between the first candle high and third candle low. Price often returns to this zone to fill the inefficiency before continuing higher.
Pro Tips & Common Mistakes
Pro Tips
- Only trade order blocks that have caused a break of market structure—this confirms institutional intent.
- The most reliable order blocks are mitigated (tested) only once. If price returns a second time, the zone weakens significantly.
- Look for a fair value gap within the order block zone for added precision on your entry.
- Use the 15-minute chart to refine your entry after identifying the order block on the 1-hour or 4-hour chart.
- Mark the order block body (open to close) as the primary zone and the wicks as the secondary zone.
Common Mistakes
- Trading every order block without checking if it caused a break of structure
- Placing stop losses too tight—right at the high of the zone instead of above it
- Ignoring higher timeframe trend direction when trading order blocks
- Not accounting for liquidity sweeps above the order block before entry
- Confusing random bullish candles with true institutional order blocks
Advanced Techniques
- Combine order blocks with the 'optimal trade entry' (OTE) zone between 61.8% and 79% Fibonacci retracement for the highest probability setups.
- Use the concept of 'order block mitigation' to track which blocks have been tested and which are fresh.
- Layer order blocks across multiple timeframes to find zones where institutional activity converges.
- Look for 'propulsion blocks'—order blocks followed by a gap—for the strongest reversal signals.
Institutional Perspective
Large institutions use algorithmic execution strategies that spread their sell orders across a price zone rather than executing at a single level. The order block represents the footprint of these algorithms. When price returns, any unfilled portion of the order activates, creating the rejection that retail traders observe.
Fun Facts
- The term 'order block' was popularized by ICT (Inner Circle Trader) and has become one of the most searched trading terms on YouTube.
- Institutional traders often use algorithmic execution that can take hours or days to fill a single order, which is why unfilled portions remain at order block levels.
- Some traders estimate that over 80% of daily forex volume comes from institutional players, making order block analysis particularly relevant in currency markets.
Frequently Asked Questions
A bearish order block is the last bullish (up-close) candle before a significant bearish displacement that breaks market structure. It represents a zone where institutional traders placed sell orders, and when price returns to this zone, it often reverses downward.
Wait for price to retrace back into the order block zone, look for rejection (such as a bearish engulfing candle or lower-timeframe break of structure), then enter short with a stop loss above the order block high and targets at the previous swing low or demand zones.
A bearish order block is invalidated when price closes decisively above the zone with strong momentum and volume. A single wick above the zone (liquidity sweep) does not invalidate it—only a sustained close above does.
An order block is a specific candle-based concept from smart money methodology that requires displacement and a break of structure. A supply zone is a broader classical technical analysis concept based on areas of selling pressure. Order blocks are more precise.