Overview
Bearish Power of Three
Also known as: PO3 Bearish, AMD Short, Accumulation Manipulation Distribution
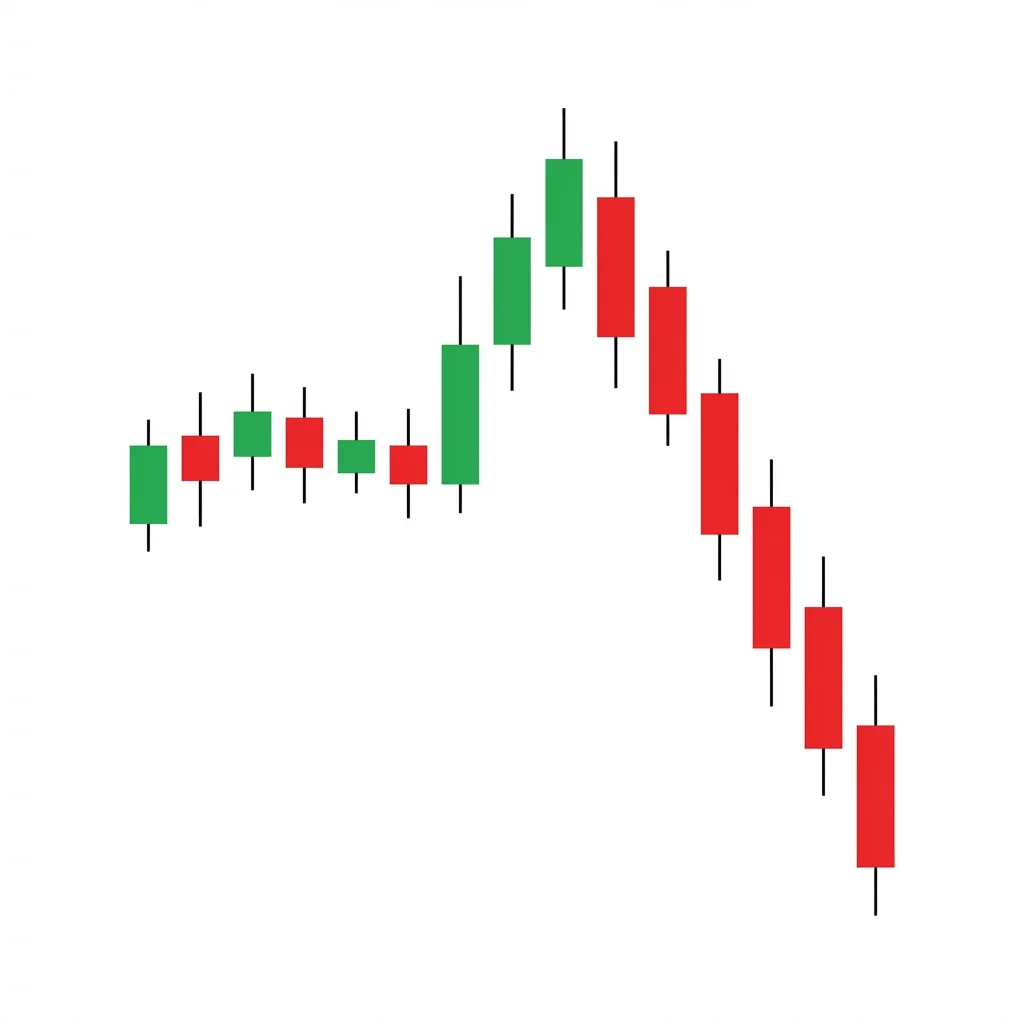
The bearish power of three (PO3) is a smart money concept describing a three-phase intraday process: accumulation (consolidation), manipulation (false breakout above the range), and distribution (sharp reversal downward). It represents how institutions engineer liquidity to fill sell orders.
The bearish power of three is an intraday pattern rooted in the ICT (Inner Circle Trader) methodology. It describes the three phases that institutional market makers execute within a single trading session or candle. During accumulation, price consolidates in a tight range (often during the Asian session in forex). During manipulation, price is pushed above this range to trigger buy stops and attract breakout traders—this provides the liquidity institutions need to sell. During distribution, the real move occurs as institutions aggressively sell, driving price below the accumulation range and trapping the breakout buyers. The result is a candle with a long upper wick (the manipulation) and a close near or below its open (the distribution). Understanding PO3 helps traders avoid being the liquidity that smart money targets.
History & Etymology
The Power of Three concept was popularized by Michael Huddleston (ICT) as part of his smart money concepts curriculum. It draws on market microstructure theory and the idea that institutional traders need liquidity to fill large orders, so they engineer false moves to attract counterparty traders.
'Power of Three' refers to the three phases: Accumulation, Manipulation, and Distribution (AMD). 'Bearish' indicates the distribution phase is to the downside.
How It Forms
Formation Steps
- 1Accumulation phase: price consolidates during early session (e.g., Asian range)
- 2Manipulation phase: price sweeps above the consolidation high (liquidity grab)
- 3Distribution phase: price reverses sharply and closes below the consolidation low
Prerequisites
- Higher-timeframe bearish bias or order block overhead
- Clear consolidation range to define the accumulation phase
- Liquidity resting above the consolidation high (buy stops)
Confirmation Signals
- Sweep of the consolidation high followed by immediate reversal
- Break of structure on the lower timeframe after the sweep
- Strong close below the consolidation low
Invalidation Signals
- Price holds above the manipulation high
- No reversal after the liquidity sweep
- Bullish follow-through instead of distribution
Candle Breakdown
PO3 Candle
A single candle that encapsulates all three phases. It opens, trades above its open (manipulation), then reverses to close at or below its open (distribution).
The long upper shadow represents the manipulation phase where retail traders were lured into buying, providing the liquidity for institutional distribution.
Psychology
The PO3 exploits the predictable behavior of retail traders who buy breakouts above consolidation zones. Institutions use this behavior to fill large sell orders before driving price lower.
Buyer Perspective
Buyers see the breakout above the consolidation range as a signal to go long, placing stop losses below the range. They are the liquidity that institutions target.
Seller Perspective
Institutional sellers know that buy stops above the consolidation provide the liquidity they need. They engineer the sweep, absorb the buy orders, and then distribute their position by selling aggressively.
Smart Money Action
Smart money engineers the manipulation phase by pushing price above the consolidation to trigger buy stops. These buy stops provide sell-side counterparty liquidity, allowing institutions to fill their short positions.
Retail Trader Trap
Retail traders buy the breakout above the consolidation range, placing stops below it. The reversal triggers these stops, accelerating the distribution move.
Emotional Cycle
Trading Strategy
Aggressive Entry
Enter short immediately when price sweeps above the consolidation high and shows the first sign of rejection (e.g., a 1-minute bearish candle).
Conservative Entry
Wait for price to break back below the consolidation range after the sweep, confirming the distribution phase has begun.
The low of the accumulation range
The next lower-timeframe demand zone or order block
The daily or session low target
Best Conditions
- Timeframe: 5m
- Timeframe: 15m
- Timeframe: 1h
- Regular trading sessions
- London and New York opens
- Pre-news positioning
- Asset: Forex
- Asset: Indices
- Asset: Crypto
Avoid When
- Timeframe: 1W
- Timeframe: 1M
- Holiday trading
- Low-liquidity environments
- Major news events
Confluence Factors
- Higher-timeframe bearish order block overhead
- Asian session range as the accumulation zone
- Fair value gap above the range as the manipulation target
- Previous session high as the sweep level
- Bearish divergence on the 15-minute RSI
Scale In Strategy
Enter initial position on the sweep rejection, add when price breaks below the accumulation range.
Scale Out Strategy
Take 50% at the accumulation range low, trail the rest to the daily target.
Risk Management
Volume Analysis
Volume Confirmation
Volume spikes during the manipulation phase as buy stops are triggered, then remains elevated during distribution as institutional selling continues.
Volume Profile
The manipulation phase shows high volume at the top of the candle, while the distribution shows heavy volume through the body.
Volume Divergence
If the manipulation sweep has low volume, it may not represent genuine institutional activity.
Technical Confluence
Support Resistance
The accumulation range high becomes the liquidity target; previous session highs and consolidation highs are key levels.
Fibonacci Levels
The manipulation phase often sweeps into the 61.8-79% retracement of the prior bearish leg (the OTE zone).
Moving Averages
The 20 EMA on the 15-minute chart often aligns with the accumulation range, providing dynamic support/resistance context.
Rsi Confirmation
RSI divergence on the 5-minute or 15-minute chart during the manipulation phase confirms the false breakout.
Macd Confirmation
MACD crossing bearish as the distribution begins confirms momentum shift.
Bollinger Bands
The manipulation sweep often pierces the upper Bollinger Band before reversing inside.
Vwap
The manipulation pushes price above VWAP; the distribution brings it back below, confirming the reversal.
Ichimoku Cloud
Distribution through the Kumo cloud on lower timeframes adds bearish conviction.
Elliott Wave
PO3 can represent a truncated Wave 5 (manipulation) followed by a corrective decline.
Wyckoff Phase
The PO3 mirrors a micro Wyckoff distribution: accumulation, upthrust (manipulation), and markdown.
Market Profile
The manipulation phase explores above the value area high before rotating back inside, a classic failed auction.
Order Flow
The order flow shows aggressive buy stops being triggered during manipulation, followed by heavy institutional selling during distribution.
Open Interest
Monitor open interest changes for additional confirmation of institutional participation in the move.
Multi-Timeframe Analysis
Higher Timeframe Alignment
Ensure the 4H or daily chart shows a bearish order block, premium pricing, or resistance zone above the accumulation range.
Lower Timeframe Entry
Use the 1-minute chart to catch the exact reversal after the manipulation sweep for a surgical entry.
Timeframe Confluence
A 15-minute PO3 setup at a 4H order block during a daily downtrend is the ideal configuration.
Top-Down Approach
Daily bearish bias > 4H order block overhead > 15M accumulation range > 5M/1M entry after the manipulation sweep.
Statistics
Historical Examples
EUR/USD PO3 at London Open
successEUR/USD consolidated during the Asian session between 1.0740-1.0755. At London open, price swept above 1.0755, triggering buy stops, then reversed sharply to 1.0700 by New York open.
Lesson: The Asian session range provides ideal accumulation zones for PO3 setups during London open.
S&P 500 PO3 During FOMC Week
successES futures consolidated in the first hour, swept above the opening range, then reversed and sold off 40 points during the FOMC announcement.
Lesson: PO3 setups before major news events can be especially powerful as institutions position ahead of the catalyst.
Variations
Asian Range PO3
PO3 that specifically uses the Asian session's range as the accumulation zone, with manipulation occurring at London open.
Opening Range PO3
PO3 based on the first 30-60 minutes of the US equity session.
Confusion Matrix
Patterns commonly confused with Bearish Power of Three and how to distinguish them.
Bearish Bull Trap
7500% similarPO3 requires a clear consolidation (accumulation) phase before the manipulation. A bull trap is simply a false breakout above any level.
Key Differences
- PO3 is a three-phase intraday process; bull traps are simpler false breakouts
- PO3 specifically targets Asian session highs or consolidation ranges
- PO3 includes the accumulation concept; bull traps do not
Bearish Upthrust
7000% similarPO3 includes the full AMD framework; an upthrust is the manipulation phase alone without the accumulation context.
Key Differences
- Upthrust is a Wyckoff concept focused on a single thrust above resistance
- PO3 specifically describes three phases within a session
- PO3 targets specific session or consolidation levels
A Bull Trap is a false breakout above resistance that lures buyers in before immediately reversing, trapping them at elevated prices and triggering a sharp sell-off as trapped longs are forced to exit.
The gap up fade occurs when price gaps higher at the open but fails to maintain the gains, reversing downward to fill the gap and often closing below the prior day's close. It signals that the gap lacked conviction.
A bearish order block is the last bullish candle before a significant bearish displacement, representing an area where institutional sellers placed large sell orders. When price returns to this zone, it often reverses downward as unfilled orders are executed.
The bearish upthrust is a Wyckoff concept where price briefly breaks above a trading range's resistance before reversing sharply back inside. This false breakout traps breakout buyers and signals that institutional sellers are using the higher prices to distribute, leading to a subsequent decline.
The Bullish Power of Three (AMD) is an ICT concept describing a three-phase market cycle: accumulation in a range, manipulation below the range to grab liquidity, followed by distribution as price rallies aggressively higher.
A bearish market structure break occurs when price in an uptrend breaks below a prior swing low, invalidating the series of higher highs and higher lows that defined the uptrend. It signals a potential trend reversal from bullish to bearish.
Pro Tips & Common Mistakes
Pro Tips
- The Asian session range is the most common accumulation zone for forex PO3 setups.
- Always mark the previous session high and the consolidation high—these are the most likely manipulation targets.
- The manipulation phase should be swift (a quick sweep and reversal). Extended time above the range suggests genuine bullishness, not manipulation.
- Look for mitigation of a higher-timeframe order block during the manipulation phase for the highest probability setups.
- Time your entries during session opens (London, New York) when PO3 setups are most common.
Common Mistakes
- Shorting every sweep above a consolidation range without higher-timeframe context
- Entering during the manipulation phase before the reversal is confirmed
- Not identifying the accumulation phase clearly before labeling a move as PO3
- Trading PO3 during low-liquidity sessions when the pattern is unreliable
- Setting targets too aggressively—PO3 is primarily an intraday setup
Advanced Techniques
- Combine PO3 with ICT kill zones (London open 2-5 AM EST, New York open 7-10 AM EST) for the highest probability setups.
- Use the 1-minute chart to time the exact reversal during the manipulation phase for the tightest possible stop loss.
- Stack PO3 with premium/discount analysis—the manipulation should take price into a premium zone (above 50% of the daily range).
- Track the 'Judas swing'—the initial false move at session open that mirrors the PO3 manipulation phase.
Institutional Perspective
The PO3 describes how market makers and institutional algorithms manage large positions. They need counterparty liquidity (retail buyers) to fill sell orders, so they briefly push price higher to trigger buy stops before executing their actual sell program.
Fun Facts
- The Power of Three concept can be observed across all timeframes, from 1-minute charts to monthly charts, demonstrating its fractal nature.
- Some traders call the manipulation phase the 'Judas swing' because it betrays traders into the wrong direction.
- The PO3 framework has become so popular that some traders believe institutional awareness of its popularity has begun to alter how the pattern manifests.
Frequently Asked Questions
The bearish Power of Three (PO3) is a three-phase pattern: accumulation (consolidation), manipulation (false breakout above the range to trigger buy stops), and distribution (sharp reversal downward). It describes how institutions engineer liquidity to fill sell orders.
PO3 setups most commonly occur at major session opens—London open (2-5 AM EST) and New York open (7-10 AM EST) in forex, and during the first 1-2 hours of equity market sessions.
Wait for the manipulation phase (sweep above the consolidation range), then enter short when price reverses back into or below the range. Place your stop above the manipulation high and target the daily low or the next demand zone.