Overview
Bullish Matching Low
Kenuki (毛抜き底の変形)
Also known as: Double Bottom Candle, Equal Lows
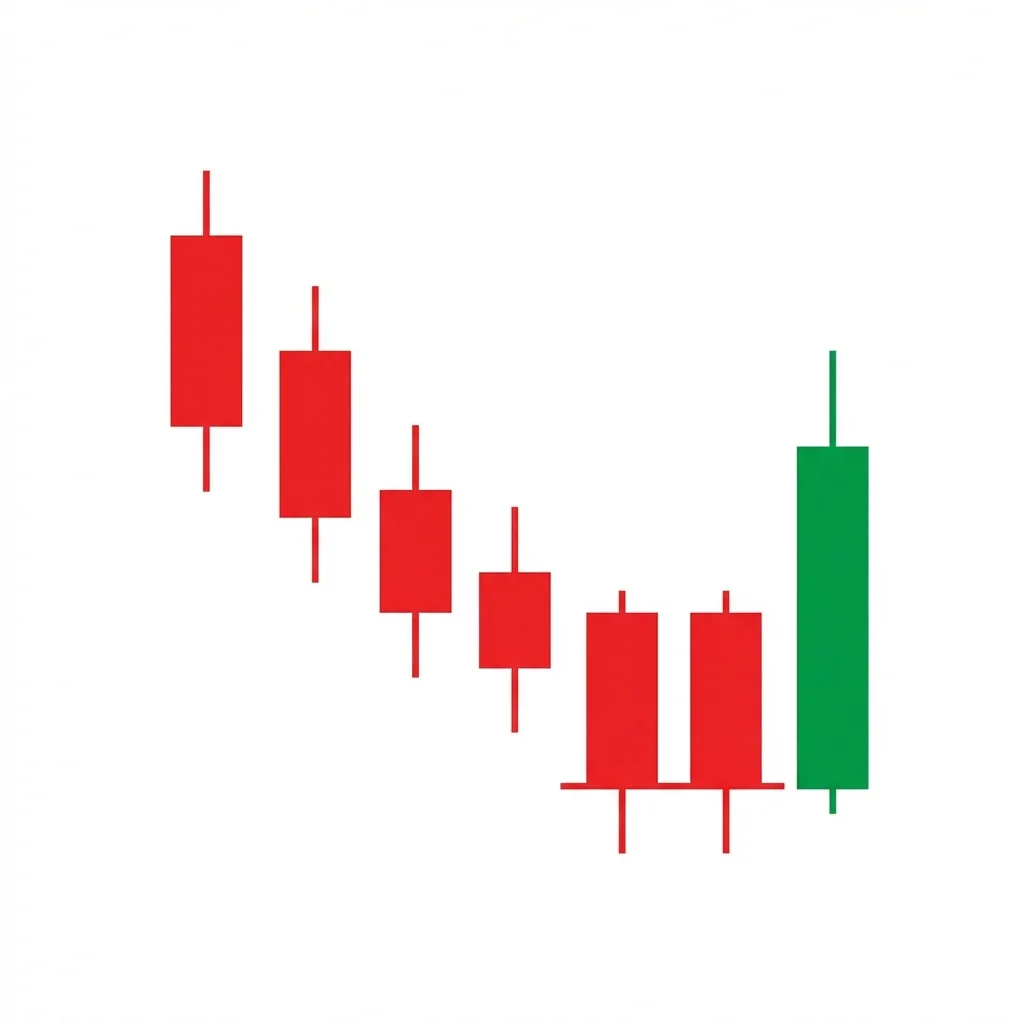
The Matching Low is a two-candle bullish reversal pattern where two consecutive bearish candles close at the same price, indicating a support level that sellers cannot breach.
The Matching Low pattern consists of two bearish candles during a downtrend that close at the same price. This double test of the same closing price suggests that sellers have twice tried to push below this level and failed. The identical closes create a de facto support floor, and when combined with a bullish confirmation candle, the pattern suggests a reversal. It is essentially a two-candle version of the double bottom concept. While the pattern's reliability is moderate, it gains significance when the matching low aligns with other support indicators.
History & Etymology
The Matching Low is documented in classical Japanese candlestick analysis as a minor reversal pattern. It is related to the tweezers family of patterns, which focus on matching price levels across consecutive candles.
The name is descriptive — two candles with matching (equal) low closing prices. The equal closes 'match,' creating a visual double bottom at the candlestick level.
How It Forms
Formation Steps
- 1First candle: a bearish candle during a downtrend
- 2Second candle: a bearish candle that closes at the same price as the first candle's close
Prerequisites
- Downtrend context
- Two bearish candles with matching close prices
- The equal closes indicate a support floor
Confirmation Signals
- Third candle is bullish and closes above the second candle's high
- Volume increases on the confirmation candle
- RSI shows bullish divergence
Invalidation Signals
- Price closes below the matching low level
- Third candle is bearish and closes lower
- Heavy volume on continued selling
Candle Breakdown
First Bearish Candle
A bearish candle continuing the downtrend, establishing the reference close price
Sellers push price lower in the existing downtrend.
Second Bearish Candle (Matching Close)
A bearish candle that closes at the exact same price as the first, confirming the support level
Sellers try again but can only push to the same level — they cannot break through. A floor has formed.
Psychology
Two identical closes establish a psychological support level. When the market tests a price twice and stops at the same level both times, it signals that underlying demand is strong enough to prevent further decline.
Buyer Perspective
Buyers notice the double test and interpret it as a reliable support floor. The inability of sellers to push lower on the second attempt gives them confidence to enter.
Seller Perspective
Sellers are frustrated by their inability to push beyond the matching low. The second failure at the same level triggers doubt about their ability to continue the decline.
Smart Money Action
Institutional limit buy orders at a specific price create the matching low. Their resting orders absorb selling at the same level twice, creating the pattern.
Retail Trader Trap
Retail bears who sold both candles find themselves unable to push below the floor. When confirmation appears, their covering fuels the reversal.
Emotional Cycle
Trading Strategy
Aggressive Entry
Enter long at the close of the second matching candle.
Conservative Entry
Wait for a bullish candle to close above the second candle's high.
Previous swing high or 1:1 R:R.
2:1 R:R.
Measured move equal to the distance from the matching low to the pattern high.
Best Conditions
- Timeframe: daily
- Timeframe: 4h
- Timeframe: weekly
- at support levels
- oversold conditions
- after extended decline
- Asset: stocks
- Asset: forex
- Asset: indices
Avoid When
- Timeframe: 1m
- Timeframe: 5m
- strong momentum downtrend
- no support nearby
Confluence Factors
- Matching low at a known support level
- RSI divergence
- Moving average support
- Fibonacci level alignment
- Declining volume
Scale In Strategy
Enter on confirmation, add on the first pullback to the matching low area.
Scale Out Strategy
Scale out at profit targets.
Risk Management
Volume Analysis
Volume Confirmation
Declining volume on the second candle suggests diminishing selling pressure.
Volume Profile
Lower volume on the second candle than the first is the ideal profile.
Volume Divergence
Higher volume on the second candle without breaking lower is actually bullish (absorption).
Technical Confluence
Support Resistance
The matching close price IS the support level — two tests confirm it.
Fibonacci Levels
The matching low at a Fibonacci retracement adds strong confluence.
Moving Averages
Matching low at a major MA confirms the support.
Rsi Confirmation
RSI bullish divergence at the matching low significantly increases reliability.
Macd Confirmation
MACD histogram flattening at the matching low confirms weakening bearish momentum.
Bollinger Bands
Matching low at the lower Bollinger Band shows oversold conditions.
Vwap
Matching low near VWAP indicates fair value support.
Ichimoku Cloud
Pattern at Kumo support adds structural confirmation.
Elliott Wave
Can appear at the end of corrective waves (A=C or Wave 2=Wave 4 relationship).
Wyckoff Phase
The double test maps to the test phase in Wyckoff accumulation.
Market Profile
Matching closes at the Value Area Low confirm institutional defense.
Order Flow
Passive buy absorption at the same price twice confirms the order.
Open Interest
Stable OI across both candles suggests the decline is exhausting.
Multi-Timeframe Analysis
Higher Timeframe Alignment
A daily matching low at weekly support is the ideal setup.
Lower Timeframe Entry
After the daily matching low, use the 4H chart for the confirmation entry.
Timeframe Confluence
The matching price level being significant on multiple timeframes strengthens the signal.
Top-Down Approach
Identify weekly support, spot the daily matching low at that price, enter on 4H confirmation.
Statistics
Historical Examples
Coca-Cola Matching Low at Support
successCoca-Cola formed a matching low at $59.50 support with two bearish candles closing at the same price. The subsequent bullish candle triggered a 7% rally.
Lesson: Matching lows in defensive stocks at established support levels are particularly reliable.
Variations
Near Matching Low
The closes are within 0.1-0.3% of each other rather than exactly matching.
Matching Low with Bullish Second Candle
The second candle is bullish but still closes at the same price as the first candle's close.
Confusion Matrix
Patterns commonly confused with Bullish Matching Low and how to distinguish them.
Bullish Tweezer Bottom
8500% similarCheck which prices match — if the closes are equal, it's a matching low. If the session lows are equal, it's a tweezer bottom.
Key Differences
- Tweezer bottom has matching LOWS (shadows); matching low has matching CLOSES
- Tweezer often has a bullish second candle; matching low has two bearish candles
The bearish matching high is a two-candle reversal pattern where two consecutive candles close at the same or very near the same price, creating a resistance level that signals the uptrend may be stalling.
The Double Bottom is one of the most recognized reversal patterns, forming a W-shape where price tests a support level twice and bounces, signaling that sellers cannot push through and buyers are gaining control.
The Bullish Engulfing is one of the most popular and reliable two-candle reversal patterns. A large bullish candle completely engulfs the prior bearish candle body, signaling a decisive shift from selling to buying control.
The Piercing Line is a two-candle bullish reversal pattern where a bearish candle is followed by a bullish candle that opens below the low and 'pierces' above the midpoint of the first candle's body, showing strong buying recovery.
The Confirmed Shooting Star adds a bearish confirmation candle to the classic shooting star, eliminating the ambiguity of the standalone pattern and creating a higher-probability reversal signal at the top of uptrends.
The Bearish Counterattack Line features a bullish candle followed by a bearish candle that gaps up at the open but closes back to the same level as the first candle's close, signaling that sellers 'counterattacked' the bullish advance.
Pro Tips & Common Mistakes
Pro Tips
- The closes must be equal or extremely close (within 0.1%) to qualify as 'matching'
- The pattern is strongest when the matching close aligns with a known support level
- Volume declining on the second candle is a positive sign — it shows selling is exhausting
- Always wait for a bullish confirmation candle before entering
- The pattern is a candlestick-level version of the double bottom concept
Common Mistakes
- Not verifying that the closes actually match (close enough is not close enough)
- Entering before the confirmation candle closes bullish
- Ignoring that both candles are bearish — the reversal needs confirmation to be valid
- Placing stops above the matching close instead of below it
- Expecting large moves — this is a moderate signal that works best for short-term bounces
Advanced Techniques
- Use the matching close as a precise stop-loss level — it's the exact price where demand was confirmed
- Combine with order flow to verify that passive buying occurred at the matching level
- Look for matching lows that also match institutional round numbers or options strikes
- Use the pattern as a filter at known support zones for higher-probability trades
Institutional Perspective
The matching close often reveals a large resting limit buy order at that exact price. Institutions use limit orders at specific prices, and when the market tests that price twice and holds, it confirms the order's presence and size.
Fun Facts
- The Matching Low is sometimes considered the candlestick equivalent of a micro double bottom.
- The precision of the matching closes can sometimes be traced to algorithmic trading programs executing at the same price.
- This pattern is one of the few that specifically focuses on the close price rather than the overall candle shape.
Frequently Asked Questions
A Matching Low consists of two bearish candles in a downtrend that close at the exact same price, indicating a support level that sellers cannot breach.
The Matching Low focuses on equal CLOSES, while the Tweezer Bottom focuses on equal LOWS (session lows, including shadows).