Overview
Bearish Measured Move Down
Also known as: Measured Decline, AB=CD Down, Two-Leg Decline, Symmetric Decline
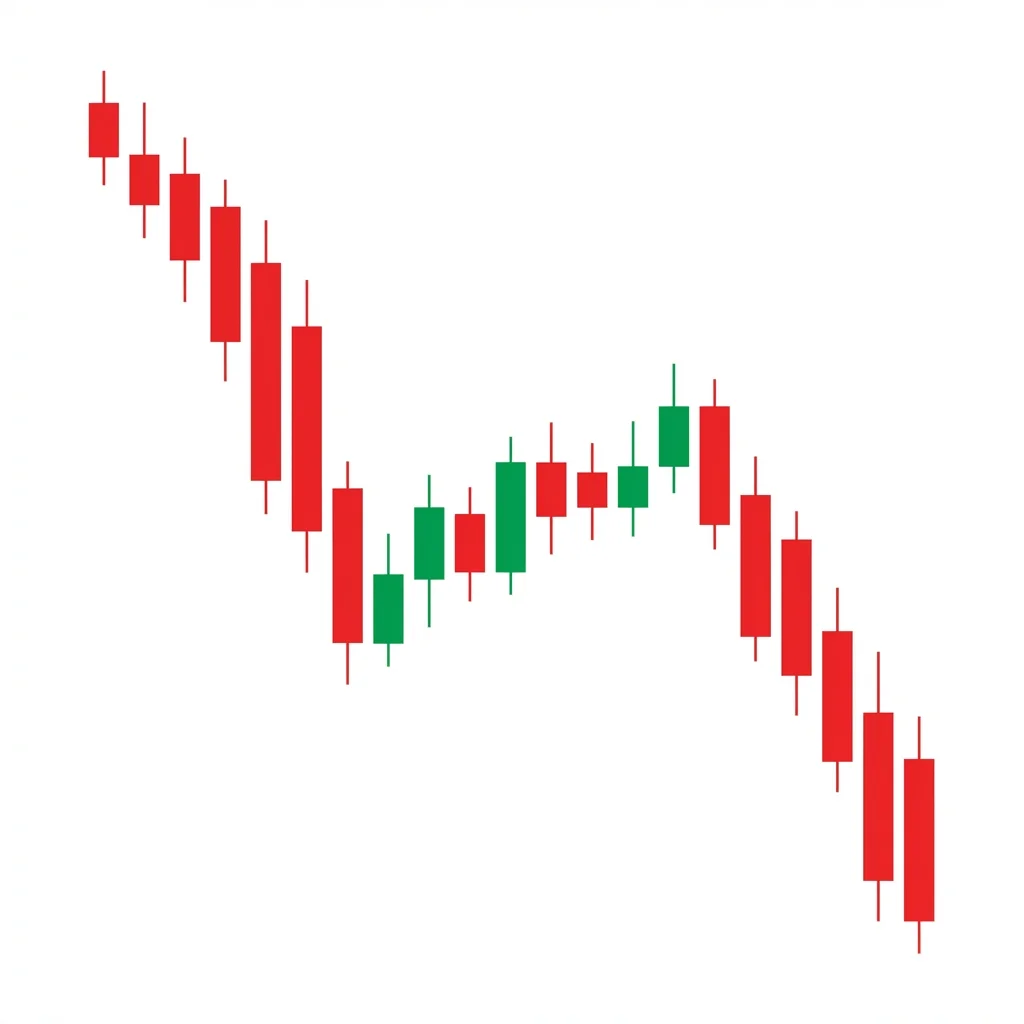
The measured move down is a two-leg decline pattern where the second leg is approximately equal in distance to the first, separated by a corrective phase. It provides a clear price target for the decline based on symmetry.
The measured move down (also known as the AB=CD pattern) is one of the most practical patterns for setting price targets. It consists of two roughly equal decline legs separated by a corrective rally or consolidation. The first leg (AB) establishes the momentum and distance. The corrective phase (BC) provides a pause and a reference point. The second leg (CD) should approximately equal the first in distance, giving traders a clear target. The pattern is based on the principle of market symmetry — moves tend to repeat in magnitude. It is widely used by both classical chartists and harmonic pattern traders.
History & Etymology
The measured move concept was described by Edwards and Magee in 'Technical Analysis of Stock Trends' and later refined by harmonic pattern traders. The AB=CD pattern was formalized by H.M. Gartley in his 1935 book 'Profits in the Stock Market' and later expanded by Scott Carney's harmonic trading methodology.
Named for its key characteristic: the second move 'measures' the same distance as the first. In harmonic trading, it is called AB=CD because the distance from A to B equals the distance from C to D.
How It Forms
Formation Steps
- 1First leg down (A to B): sharp decline from high to intermediate low
- 2Corrective phase (B to C): rally or consolidation retracing part of the first leg
- 3Second leg down (C to D): decline of approximately equal distance to the first leg
- 4The two legs are roughly equal in length (AB ≈ CD)
Prerequisites
- Initial decline leg (AB) to measure from
- Corrective rally (BC) that retraces part of the decline
Confirmation Signals
- Second leg reaches approximately the same length as the first
- Volume patterns mirror between the two legs
- The corrective phase retraces 38.2-61.8% of the first leg
Invalidation Signals
- Corrective phase retraces more than 100% of the first leg
- Second leg fails to reach even 50% of the first leg's distance
- Strong bullish reversal during the second leg
Candle Breakdown
First Leg (A to B)
A sharp decline leg establishing the pattern's measurement baseline.
Strong selling creates the first impulse leg. This distance becomes the measured reference.
Corrective Phase (B to C)
A rally or consolidation retracing typically 38.2-61.8% of the first leg.
Brief relief rally or consolidation. Sellers pause and weak hands cover shorts.
Second Leg (C to D)
A decline of approximately equal distance to the first leg, completing the measured move.
Selling resumes with similar intensity. The symmetry of the two legs reflects the market's tendency toward proportional moves.
Psychology
The measured move reflects the market's tendency toward symmetry. Traders and algorithms that measure the first leg and project the second create a self-fulfilling prophecy that makes the pattern reliable.
Buyer Perspective
Buyers during the corrective phase hope for a reversal but face the reality of a second leg down. Those who bought during B-to-C are trapped.
Seller Perspective
Sellers who profited from the first leg re-enter on the correction, expecting the second leg to mirror the first. This expectation creates the selling pressure that fulfills the measured move.
Smart Money Action
Institutions use the first leg to assess market momentum, the corrective phase to reload short positions, and the second leg to complete their selling program.
Retail Trader Trap
Retail traders buy the corrective phase believing the downtrend is over. The second leg traps them at worse levels.
Emotional Cycle
Trading Strategy
Aggressive Entry
Short at the top of the corrective phase (C point) when it reaches the 50-61.8% retracement of AB.
Conservative Entry
Short when the second leg breaks below the B point (the first leg's low), confirming the measured move is in progress.
D point: AB distance projected down from C.
127.2% extension of AB from C.
161.8% extension of AB from C.
Best Conditions
- Timeframe: daily
- Timeframe: 4h
- Timeframe: 1h
- Timeframe: weekly
- trending down
- bear market
- sector weakness
- Asset: stocks
- Asset: forex
- Asset: indices
- Asset: crypto
Avoid When
- Timeframe: 1m
- Timeframe: 5m
- reversal conditions
- V-bottom
Confluence Factors
- C point at a Fibonacci retracement level
- C point at a moving average
- Second leg supported by volume
- D target at a known support level
- RSI confirming bearish momentum
Scale In Strategy
Enter 50% at the C point rejection, add 50% on break below the B point.
Scale Out Strategy
Take 50% at the D target, trail rest to the 127.2% extension.
Risk Management
Volume Analysis
Volume Confirmation
Volume should decrease during the correction and increase on the second leg, mirroring the first leg.
Volume Profile
The corrective phase should show a low-volume node, confirming it is a pause rather than accumulation.
Volume Divergence
If the second leg has significantly lower volume than the first, the measured move may fall short.
Technical Confluence
Support Resistance
The D target often aligns with significant support levels, adding confluence.
Fibonacci Levels
The entire pattern IS a Fibonacci structure. BC typically retraces 38.2-61.8% of AB. CD equals AB (100% projection).
Moving Averages
The C point often aligns with a declining moving average acting as resistance.
Rsi Confirmation
RSI below 50 during the second leg confirms bearish momentum.
Macd Confirmation
MACD negative during both legs with a brief uptick during the correction.
Bollinger Bands
Price bouncing from the lower band during the correction to the middle band, then returning to the lower band.
Vwap
VWAP acting as resistance during the C point correction.
Ichimoku Cloud
The C point rejecting at the Kumo cloud edge.
Elliott Wave
The measured move often corresponds to Wave 1 (AB), Wave 2 (BC), and Wave 3 (CD) in Elliott Wave theory.
Wyckoff Phase
The corrective phase is an automatic rally within the markdown, and the second leg is the continuation of markdown.
Market Profile
The corrective phase creates a brief balance area before the measured move continues.
Order Flow
Selling intensity on the second leg should approximate the first leg.
Open Interest
Rising OI on the second leg confirms new shorts.
Multi-Timeframe Analysis
Higher Timeframe Alignment
Measured moves on the weekly provide the most significant targets.
Lower Timeframe Entry
Use 4H to time the entry at the C point within a daily measured move.
Timeframe Confluence
D target aligning on both daily and weekly charts is a strong target.
Top-Down Approach
Weekly downtrend → Daily measured move → 4H entry at C point → Target D.
Statistics
Historical Examples
SPY Measured Move 2022
successSPY's first leg from January to March 2022 (475→420) measured 55 points. After a corrective rally to 460 (C), the second leg took SPY to 360 — slightly exceeding the measured move target of ~405.
Lesson: Measured moves in indices often meet or exceed their targets during bear markets.
Variations
Exact Measured Move
Second leg equals the first leg to within 5%.
Extended Measured Move
Second leg extends to 127.2-161.8% of the first.
Confusion Matrix
Patterns commonly confused with Bearish Measured Move Down and how to distinguish them.
Bearish Flag
70% similarIf you are measuring the distance of two decline legs for a target, it is a measured move. If you are analyzing the consolidation shape (parallel channel), it is a flag. The flagpole target and measured move target are often similar.
Key Differences
- Measured move focuses on the equality of legs; flag focuses on the consolidation shape
- Measured move provides a specific target; flag uses flagpole projection
- The concepts overlap significantly
The Descending Channel is a chart formation where price trends lower within two parallel downward-sloping trendlines, making consistent lower highs and lower lows in an orderly bearish progression.
The bearish flag is a continuation pattern consisting of a sharp decline (flagpole) followed by a gentle upward-sloping consolidation (flag) before price breaks down to continue the trend.
The Measured Move Up is a bullish pattern where two rally legs of approximately equal length are separated by a correction, allowing traders to project the second leg's target by measuring the first leg's distance.
The Broadening Top (Megaphone) is a chart formation characterized by expanding price swings that create higher highs and lower lows, reflecting increasing volatility and instability at market tops before a bearish breakdown.
The Descending Triangle is a bearish continuation pattern featuring a flat support level with lower highs converging into an apex, typically resolving with a breakdown below the horizontal support as sellers gradually overwhelm buyers.
The Diamond Top is a rare reversal pattern that forms at market peaks, consisting of a broadening formation followed by a contracting formation, creating a diamond shape that signals a shift from expansion to contraction and ultimately a bearish breakdown.
Pro Tips & Common Mistakes
Pro Tips
- The corrective phase retracing 38.2-61.8% of the first leg provides the ideal C point.
- The second leg does not need to be exactly equal — 85-115% of the first leg is considered a successful measured move.
- Use multiple measurement techniques (flagpole, Fibonacci extensions) to identify confluent targets.
- The time duration of the two legs is often approximately equal as well (time symmetry).
Common Mistakes
- Expecting exact equality — measured moves are approximate, not precise.
- Not accounting for the corrective phase depth in the projection.
- Using the measured move in ranging markets where symmetry is less reliable.
- Holding through the target expecting additional extension without evidence.
Advanced Techniques
- Combine with harmonic ABCD pattern rules for more precise targeting.
- Use Fibonacci extensions from BC to refine the D target: 127.2% and 161.8% CD are common extended targets.
- Overlay time analysis: if the first leg took 10 days, the second leg often completes in approximately 10 days.
- Use the measured move within Elliott Wave analysis to project Wave 3 targets from Wave 1 measurements.
Institutional Perspective
Institutional selling programs often execute in two phases (two legs) with a pause for absorption. The measured move reflects this institutional behavior pattern.
Fun Facts
- The measured move concept dates back to the 1930s with H.M. Gartley's work on harmonic patterns.
- The AB=CD pattern is the simplest harmonic pattern and the foundation of all more complex harmonic structures (Gartley, Butterfly, etc.).
- Algorithmic trading systems frequently use measured move projections for automated target setting.
Frequently Asked Questions
A measured move is a two-leg decline where the second leg is approximately equal in distance to the first, separated by a corrective phase. It provides a clear price target based on the principle of market symmetry.
Measure the distance of the first leg (A to B). Then project that same distance downward from the C point (the end of the corrective phase). This gives you the D target.
The target is reached approximately 67% of the time. Most successful completions fall within 85-115% of the exact measured distance. Fibonacci extensions (127.2%, 161.8%) can identify extended targets.