Overview
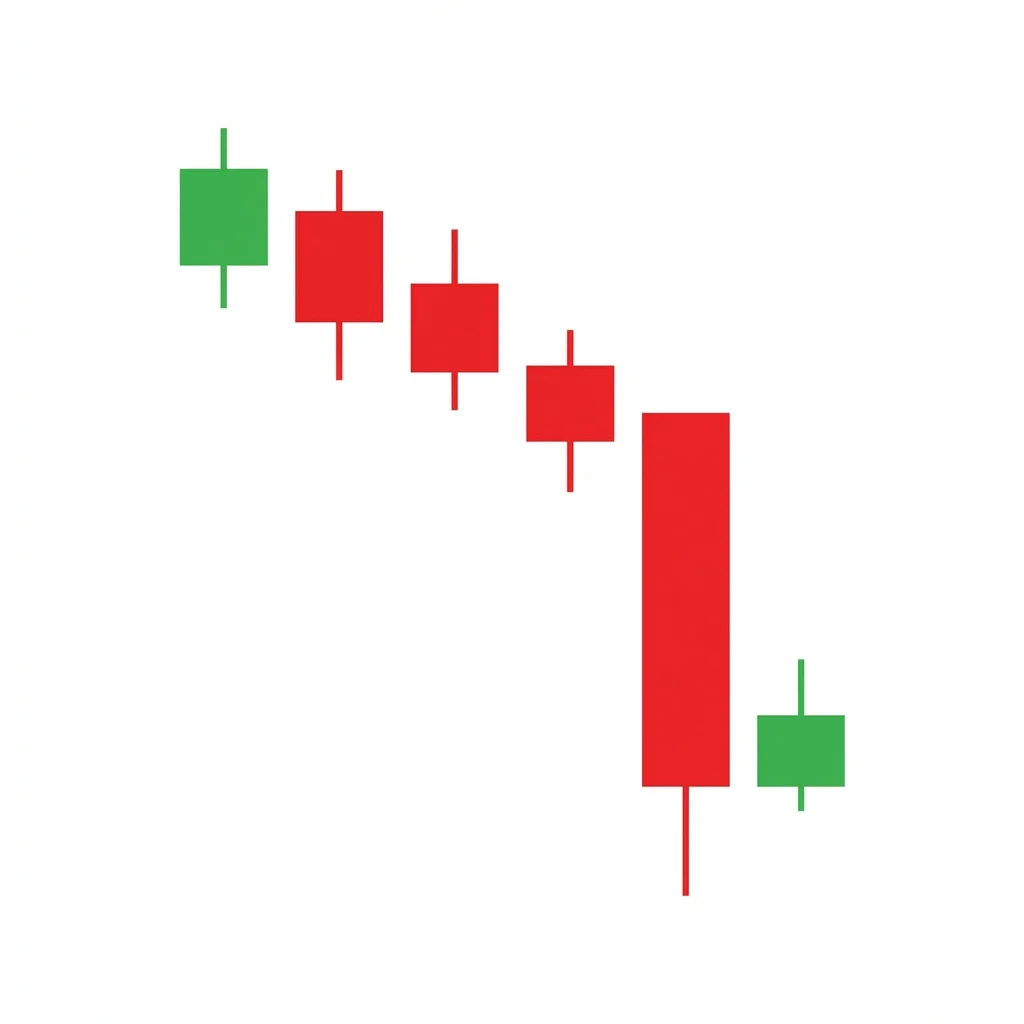
Bearish On Neck
Ate Kubi
Also known as: On Neck Line, On-Neck Pattern
The bearish on neck is a two-candle continuation pattern where a bullish second candle closes at the first bearish candle's low, showing that buyers could only push price to the weakest resistance level — the prior candle's low.
The on neck pattern is the weakest of the neck pattern family (on neck, in neck, thrusting). It occurs when a small bullish candle opens below the prior bearish candle's low and rallies, but can only close at the prior candle's low — not even reaching its close. This is the most bearish outcome of the neck patterns because buyers couldn't even reclaim the prior session's closing price. The rally was so weak that it only reached the minimum resistance level. The pattern confirms that the downtrend is strongly intact and further decline is expected.
History & Etymology
The on neck pattern is part of the traditional Japanese candlestick continuation pattern family. Japanese rice traders classified neck patterns by the degree of bullish penetration into the prior bearish candle — on neck being the weakest (least penetration).
The 'on neck' (ate kubi) name refers to the second candle's close being exactly 'on' the prior candle's low — the 'neck' or lowest point. It shows the buying attempt could only reach the minimum possible recovery point.
How It Forms
Formation Steps
- 1First candle: a long bearish candle in a downtrend
- 2Second candle: opens below the first candle's low (gap down)
- 3Second candle rallies but only closes at or near the first candle's low
- 4The second candle fails to penetrate into the first candle's body at all
Prerequisites
- Established downtrend
- Long bearish first candle
Confirmation Signals
- Third candle closes below the second candle's low
- Volume remains strong on the continuation
- No further upside progress
Invalidation Signals
- Price continues above the first candle's close
- Strong bullish follow-through
- Third candle is bullish
Candle Breakdown
Bearish Candle
A long bearish candle continuing the downtrend.
Strong selling. Bears in firm control.
On Neck Candle
A small bullish candle opening below the prior low and closing at the prior candle's low.
Buyers try but can only reach the prior low. This is the weakest possible recovery — no penetration into the body at all.
Psychology
The on neck shows that even the counter-trend buying attempt was pathetically weak. Reaching only the prior candle's low means buyers couldn't even begin to challenge the sellers' territory.
Buyer Perspective
Buyers attempt a rally but can only recover to the prior low. Their weakness is fully exposed.
Seller Perspective
Sellers see the failed rally as confirmation of their dominance. The inability to even reach the prior close is deeply bearish.
Smart Money Action
Institutions note the weak buying attempt and may add to shorts at the prior low level.
Retail Trader Trap
Retail traders buy the gap down but the rally fizzles at the weakest resistance.
Emotional Cycle
Trading Strategy
Aggressive Entry
Short on the close of the second candle.
Conservative Entry
Short when the third candle closes below the second candle's low.
First candle's body projected downward.
Next support level.
2x the first candle's body.
Best Conditions
- Timeframe: daily
- Timeframe: 4h
- strong downtrend
- bear market
- Asset: stocks
- Asset: forex
- Asset: indices
Avoid When
- Timeframe: 1m
- Timeframe: 5m
- oversold bounce
- reversal conditions
Confluence Factors
- Strong downtrend
- RSI below 50
- Moving averages declining
- Low volume on second candle
- Sector weakness
Scale In Strategy
Enter 50% on the second candle's close, 50% on confirmation.
Scale Out Strategy
Take 50% at TP1, trail rest.
Risk Management
Volume Analysis
Volume Confirmation
Low volume on the second candle confirms weak buying.
Volume Profile
The prior low should show limited buying interest in the volume profile.
Volume Divergence
High volume on the second candle suggests genuine buying — the pattern may fail.
Technical Confluence
Support Resistance
The first candle's low is the 'on neck' level — it acts as the weakest resistance.
Fibonacci Levels
The second candle fails to reach even the 23.6% retracement of the first candle — extremely weak.
Moving Averages
Pattern below declining MAs confirms bearish context.
Rsi Confirmation
RSI below 50 throughout.
Macd Confirmation
MACD negative.
Bollinger Bands
Price near or below the lower band.
Vwap
Below VWAP.
Ichimoku Cloud
Below Kumo cloud.
Elliott Wave
Common during impulsive decline waves.
Wyckoff Phase
Brief automatic rally in markdown.
Market Profile
Failed expansion above the prior low.
Order Flow
Passive selling at the prior low absorbs buying.
Open Interest
Stable — trend intact.
Multi-Timeframe Analysis
Higher Timeframe Alignment
On neck within a weekly downtrend is ideal.
Lower Timeframe Entry
Use 4H to time the entry.
Timeframe Confluence
Pattern on daily within weekly downtrend.
Top-Down Approach
Weekly downtrend → Daily on neck → 4H entry.
Statistics
Historical Examples
General Electric On Neck Pattern
successGE formed multiple on neck patterns during its long decline from $30 to $6. Each weak rally to the prior low confirmed the relentless downtrend.
Lesson: On neck patterns in stocks with deteriorating fundamentals are highly reliable continuation signals.
Variations
Perfect On Neck
Close matches the prior low exactly.
Near On Neck
Close is very close to the prior low (within a few ticks).
Confusion Matrix
Patterns commonly confused with Bearish On Neck and how to distinguish them.
Bearish In Neck
90% similarCheck where the second candle closes relative to the first: at the LOW = on neck. At the CLOSE = in neck.
Key Differences
- On neck closes at the prior LOW; in neck closes at the prior CLOSE
- On neck shows weaker buying than in neck
- On neck is more bearish
The Dark Cloud Cover is a two-candle bearish reversal pattern where a bearish candle opens above the prior bullish candle's high and closes below its midpoint, signaling that the bullish 'sky' is being covered by a bearish 'dark cloud.'
The bearish in neck pattern is a two-candle continuation pattern where a bullish second candle closes at or barely above the first bearish candle's close, showing insufficient buying power to reverse the downtrend.
Three black crows is a powerful bearish reversal pattern consisting of three consecutive long bearish candles, each opening within the prior candle's body and closing near its low. It signals strong, persistent selling pressure and a likely trend reversal.
The bearish thrusting pattern is a two-candle continuation signal in a downtrend. A long bearish candle is followed by a bullish candle that opens below the first candle's low but closes below its midpoint, showing insufficient buying strength to reverse the trend.
The Confirmed Shooting Star adds a bearish confirmation candle to the classic shooting star, eliminating the ambiguity of the standalone pattern and creating a higher-probability reversal signal at the top of uptrends.
The Bearish Counterattack Line features a bullish candle followed by a bearish candle that gaps up at the open but closes back to the same level as the first candle's close, signaling that sellers 'counterattacked' the bullish advance.
Pro Tips & Common Mistakes
Pro Tips
- The on neck is the most bearish of the neck family because the buying only reaches the weakest level (the prior low).
- Compare the three neck patterns: on neck (closes at low) > in neck (closes at close) > thrusting (closes into body). More penetration = less bearish.
- Volume declining on the second candle is essential — it confirms weak buying.
- Best used as a confirmation of existing downtrend rather than as a standalone signal.
Common Mistakes
- Confusing on neck with piercing line — the piercing line closes above the midpoint of the first body.
- Trading this pattern in oversold or reversal conditions.
- Not comparing with in neck and thrusting to accurately classify the penetration level.
- Expecting large moves without additional confluence.
Advanced Techniques
- Use the neck pattern family as a spectrum of bearish strength.
- Combine with order flow to confirm that selling absorbed all buying at the prior low.
- Monitor for multiple neck patterns in succession — they confirm persistent seller domination.
Institutional Perspective
The on neck pattern shows institutional selling is so dominant that counter-trend rallies cannot even reach the prior session's closing price.
Fun Facts
- The neck pattern family (on neck, in neck, thrusting) creates a spectrum from most bearish to least bearish based on the depth of the second candle's penetration.
- The on neck is the rarest of the three because such precise closes at the prior low are uncommon.
Frequently Asked Questions
The on neck is a two-candle bearish continuation pattern where a bullish candle following a bearish candle can only close at the prior candle's low — the weakest possible recovery.
On neck (closes at prior low) is the most bearish. In neck (closes at prior close) is moderately bearish. Thrusting (closes into body) is the least bearish. More penetration into the first candle's body means more buying strength.