Overview
Bearish Rectangle Breakdown
Also known as: Trading Range Breakdown, Box Breakdown, Flat Base Breakdown
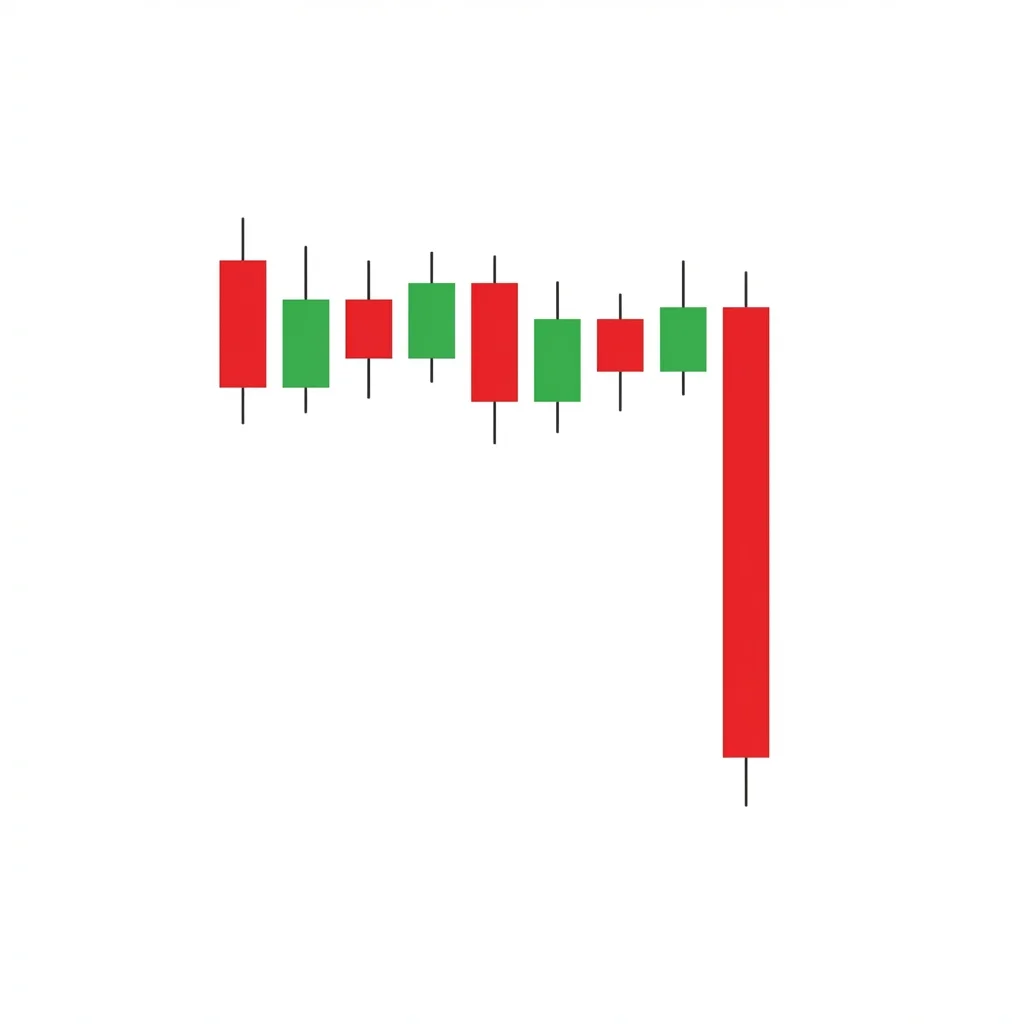
A bearish rectangle breakdown occurs when price trades in a horizontal range between parallel support and resistance before breaking below support. The measured move target equals the height of the rectangle projected downward from the breakdown point.
The bearish rectangle is a consolidation pattern where price bounces between horizontal support and resistance lines, creating a box-like structure. This trading range represents a temporary equilibrium between buyers and sellers. When the equilibrium breaks—with price closing below support on increased volume—it signals that sellers have won the battle and the prior downtrend is likely to resume. The measured move target is the height of the rectangle subtracted from the breakdown point. Rectangles can last from a few weeks to several months, and the longer the consolidation, the more powerful the eventual breakdown tends to be. Volume typically decreases during the consolidation and expands on the breakdown.
History & Etymology
Rectangle patterns have been documented since the earliest days of technical analysis. Richard Schabacker described them in the 1930s, and Edwards and Magee formalized the pattern in their 1948 book. The pattern is also related to Wyckoff's concept of trading ranges and redistribution phases.
Named for its rectangular shape formed by parallel horizontal support and resistance lines. 'Breakdown' specifies that price exits the rectangle through the lower boundary, indicating a bearish outcome.
How It Forms
Formation Steps
- 1Price oscillates between well-defined horizontal support and resistance levels
- 2At least two touches of both the upper and lower boundaries
- 3The rectangle forms after a prior downtrend (for continuation) or at a top (for reversal)
- 4Price breaks below the lower boundary with increased volume
Prerequisites
- Prior downtrend or distribution phase
- Clear horizontal support and resistance levels
- Multiple bounces between the boundaries
Confirmation Signals
- Close below the rectangle's support with increased volume
- Failed retest of the broken support (now resistance)
- Momentum indicators confirming downside
Invalidation Signals
- Price breaks above the rectangle's resistance
- Strong bullish volume within the rectangle
- Higher lows forming inside the range
Candle Breakdown
Range-Bound Candles
A series of candles bouncing between horizontal support and resistance, forming the rectangular consolidation zone.
Neither buyers nor sellers have conviction. The market is in equilibrium, digesting the prior move.
Breakdown Candle
A strong bearish candle that closes below the rectangle's support level with increased volume.
Sellers finally overwhelm buyers at the support level. Stop losses below support trigger, accelerating the decline.
Psychology
The rectangle represents a battle between buyers defending support and sellers defending resistance. When support finally breaks, it releases the pent-up energy of the entire consolidation period.
Buyer Perspective
Buyers repeatedly defend the support level, growing confident it will hold. When it finally breaks, their capitulation adds to selling pressure.
Seller Perspective
Sellers gradually wear down support through repeated tests. Each bounce off support is weaker until the level finally gives way.
Smart Money Action
Institutional traders use the rectangle to distribute their holdings, selling at resistance and allowing price to return to support before selling more. The breakdown occurs once distribution is complete.
Retail Trader Trap
Range traders who buy at support one final time get trapped when the breakdown occurs, providing additional selling pressure.
Emotional Cycle
Trading Strategy
Aggressive Entry
Enter short when price breaks below the rectangle's support intraday, before the close.
Conservative Entry
Wait for a daily close below support, then enter on a pullback that retests the broken support as resistance.
Height of the rectangle projected downward from the breakdown point
Next major support level below
150% of the rectangle height for extended moves
Best Conditions
- Timeframe: 1D
- Timeframe: 4h
- Timeframe: 1W
- Downtrending markets
- Distribution phases
- Post-earnings consolidation
- Asset: Stocks
- Asset: Indices
- Asset: Forex
Avoid When
- Timeframe: 1m
- Timeframe: 5m
- Strong bull markets
- High-momentum environments
Confluence Factors
- Rectangle forms after a prior downtrend (continuation bias)
- Decreasing volume pattern during consolidation
- Moving averages trending down above the rectangle
- Bearish divergence on RSI during the range
- Rectangle support aligns with a round number
Scale In Strategy
Enter initial position on the breakdown and add on the retest of the broken support if it holds as resistance.
Scale Out Strategy
Take 50% at the measured move, trail the rest with a moving average.
Risk Management
Volume Analysis
Volume Confirmation
Volume should be below average during the rectangle and spike 50%+ on the breakdown candle.
Volume Profile
Low volume during the consolidation with increasing volume on each successive test of support suggests weakening demand.
Volume Divergence
Increasing volume on rallies to resistance during the rectangle may suggest an upside breakout instead—be cautious.
Technical Confluence
Support Resistance
The rectangle's boundaries are by definition support and resistance. The broken support becomes the key resistance level to watch.
Fibonacci Levels
If the rectangle forms between Fibonacci retracement levels (e.g., 38.2% and 50%), the breakdown confirms the continuation of the larger trend.
Moving Averages
The 50 and 200 SMA often flatten during the rectangle. A death cross forming during the consolidation adds bearish conviction.
Rsi Confirmation
RSI oscillating between 40-60 during the rectangle, then breaking below 40 on the breakdown, confirms the bearish shift.
Macd Confirmation
MACD histogram making lower highs during the rectangle despite price making equal highs suggests underlying bearish pressure.
Bollinger Bands
Bollinger Bands squeeze during the rectangle; the breakdown through the lower band triggers a volatility expansion.
Vwap
Multiple days of VWAP below the rectangle's midpoint during consolidation suggests distribution.
Ichimoku Cloud
The Kumo cloud turning bearish during the rectangle consolidation supports the breakdown direction.
Elliott Wave
Rectangles often form as Wave 4 or Wave B consolidations in Elliott Wave theory.
Wyckoff Phase
The rectangle closely resembles Wyckoff's redistribution trading range, with the breakdown being the Sign of Weakness.
Market Profile
The rectangle defines a clear value area. The breakdown is a failed auction that rotates price out of value to the downside.
Order Flow
Cumulative delta trending negative during the rectangle shows that sells are exceeding buys despite the sideways price action.
Open Interest
Monitor open interest changes for additional confirmation of institutional participation in the move.
Multi-Timeframe Analysis
Higher Timeframe Alignment
A daily rectangle is strongest when the weekly chart shows a clear downtrend with price below the 50 and 200 SMAs.
Lower Timeframe Entry
Use the 1H chart to time the breakdown entry from a daily rectangle—look for a lower-timeframe break of structure at the rectangle's support.
Timeframe Confluence
A 4H rectangle at a daily support level, with a weekly downtrend, provides the highest conviction setup.
Top-Down Approach
Confirm the weekly downtrend, identify the daily rectangle, and time the entry on the 4H or 1H chart.
Statistics
Historical Examples
Meta Platforms Rectangle Breakdown
successMeta traded in a rectangle between $300-$340 for several weeks before breaking down on disappointing earnings. The stock fell to $90 over the next nine months, far exceeding the measured move.
Lesson: Fundamental catalysts can accelerate rectangle breakdowns far beyond the measured move target.
USD/JPY Rectangle Breakdown
successUSD/JPY consolidated in a 150-pip rectangle for two weeks before breaking down. The pair fell 300 pips, meeting the measured move target exactly.
Lesson: Forex rectangles tend to produce measured moves that are quite accurate, making them reliable for setting profit targets.
Variations
Slanted Rectangle
A rectangle with a very slight downward tilt on both boundaries, suggesting sellers have a marginal edge.
Rectangle with Volume Climax
A rectangle breakdown accompanied by the highest volume bar in the entire consolidation period.
Confusion Matrix
Patterns commonly confused with Bearish Rectangle Breakdown and how to distinguish them.
Bearish Descending Triangle
7000% similarCheck if the swing highs within the consolidation are declining. If yes, it is a descending triangle. If the highs are roughly equal (parallel), it is a rectangle.
Key Differences
- Rectangles have parallel boundaries; descending triangles have a flat bottom and declining top
- Rectangles show equal highs and lows; descending triangles show lower highs
- Descending triangles inherently bias toward breakdown; rectangles can break either way
Bearish Redistribution
8500% similarIf you can identify Wyckoff phases (PSY, BC, AR, ST, UT) within the range, it is redistribution. A simple horizontal range is a rectangle.
Key Differences
- Redistribution is a Wyckoff concept with specific phases; rectangles are simpler
- Redistribution includes springs, upthrusts, and signs of weakness
- Rectangles are defined purely by price structure
The Descending Triangle is a bearish continuation pattern featuring a flat support level with lower highs converging into an apex, typically resolving with a breakdown below the horizontal support as sellers gradually overwhelm buyers.
The bearish flag is a continuation pattern consisting of a sharp decline (flagpole) followed by a gentle upward-sloping consolidation (flag) before price breaks down to continue the trend.
Bearish redistribution is a Wyckoff concept describing a trading range that forms during a downtrend, where institutional sellers redistribute their remaining positions before the markdown resumes. It mirrors distribution but occurs mid-trend rather than at a top.
Three black crows is a powerful bearish reversal pattern consisting of three consecutive long bearish candles, each opening within the prior candle's body and closing near its low. It signals strong, persistent selling pressure and a likely trend reversal.
The Bullish Rectangle Breakout is a continuation pattern where price consolidates between horizontal support and resistance before breaking above the upper boundary to resume the uptrend.
The Broadening Top (Megaphone) is a chart formation characterized by expanding price swings that create higher highs and lower lows, reflecting increasing volatility and instability at market tops before a bearish breakdown.
Pro Tips & Common Mistakes
Pro Tips
- The longer the rectangle consolidation, the more powerful the eventual breakdown.
- Count the number of touches on support—the more touches, the weaker the level becomes.
- Watch for volume drying up progressively during the consolidation as a precursor to breakdown.
- Failed breakouts above the rectangle's resistance often lead to powerful breakdowns—watch for 'springs' and failures.
- The retest of broken support is one of the best entry opportunities, occurring roughly 60% of the time.
Common Mistakes
- Trading the breakdown without volume confirmation—low-volume breakdowns often reverse
- Setting the measured move target too aggressively (use 100% of rectangle height, not more)
- Not drawing the rectangle boundaries correctly—use closing prices for accuracy
- Entering on the first break of support without waiting for a close below it
- Ignoring the possibility of a false breakdown (spring) in Wyckoff terms
Advanced Techniques
- Use the volume-weighted average price (VWAP) anchored to the start of the rectangle to gauge whether sellers or buyers are in control.
- Apply delta analysis to the rectangle: if cumulative delta trends negative during the range, the breakdown probability increases.
- Look for internal structure within the rectangle—if lower highs start forming, the breakdown is imminent.
- Measure the rectangle's duration: if the consolidation is roughly half the time of the prior trend, the measured move is more reliable.
Institutional Perspective
Institutions use rectangle consolidations as redistribution zones—they sell into buying pressure at resistance and allow price to fall back to support, repeating the cycle until their position is fully distributed. The breakdown signals distribution is complete.
Fun Facts
- Rectangles are sometimes called 'line formations' because the horizontal boundaries look like two parallel lines on a chart.
- Thomas Bulkowski found that rectangle breakdowns have a higher success rate when the prior trend is down (continuation) versus up (reversal).
- The rectangle pattern is the visual equivalent of the Wyckoff redistribution trading range.
Frequently Asked Questions
A bearish rectangle breakdown occurs when price breaks below the horizontal support of a trading range (rectangle). The measured move target equals the height of the rectangle projected downward from the breakdown point.
Rectangles can last from a few weeks to several months. Generally, the longer the consolidation, the more powerful the eventual breakdown. Most tradeable rectangles last 3-12 weeks on daily charts.
Approximately 60% of rectangle breakdowns produce a retest of the broken support level. This retest is one of the best entry opportunities, as it confirms the breakdown and provides a clear stop-loss level.