Overview
Bearish Resistance Rejection
Also known as: Resistance Reversal, Supply Zone Rejection, Failed Breakout at Resistance
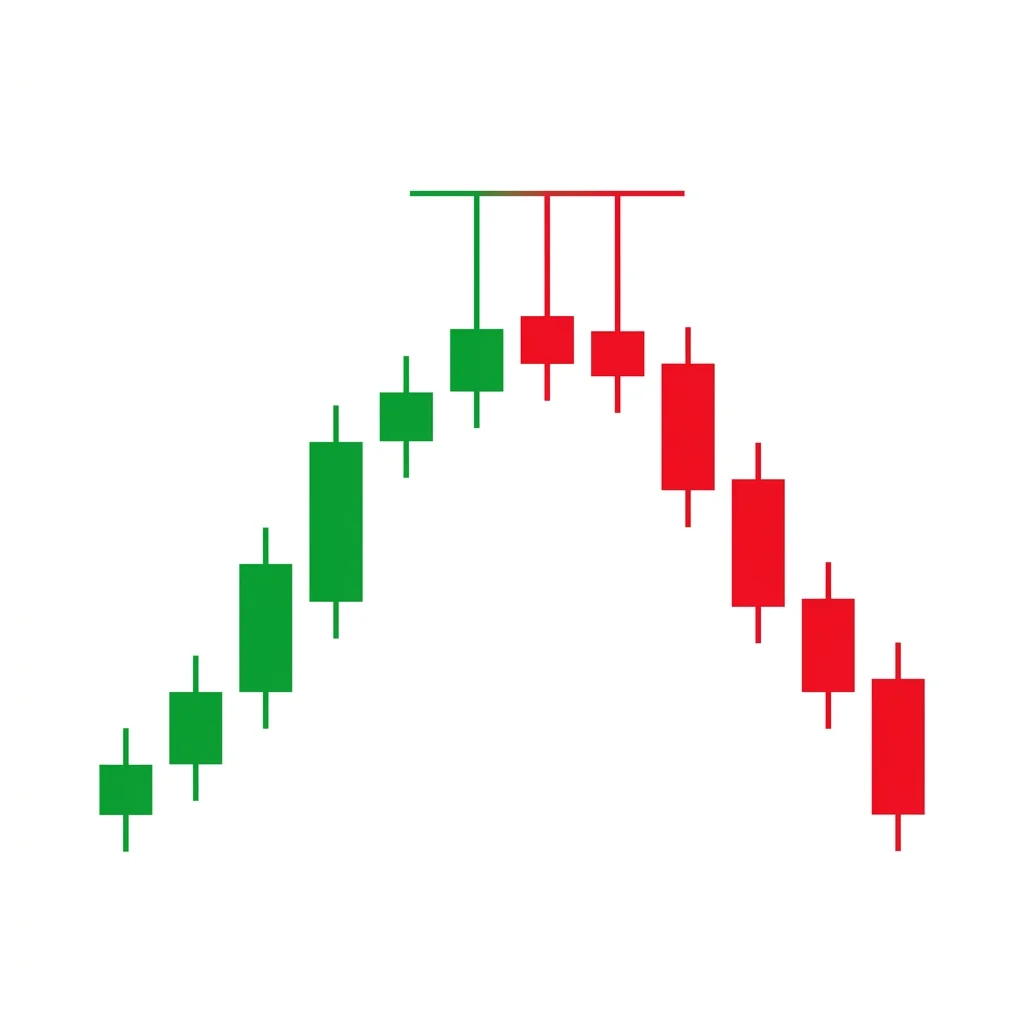
A bearish resistance rejection occurs when price rallies into a well-established resistance level and is met with selling pressure, producing bearish candles with long upper wicks. The repeated failure to break through resistance signals a reversal.
The bearish resistance rejection is one of the most fundamental and widely used patterns in technical analysis. It occurs when price approaches a horizontal resistance level—a price zone where sellers have historically overwhelmed buyers—and fails to break through. The rejection is visible through bearish candlestick formations at the resistance level: long upper shadows, bearish engulfing candles, shooting stars, or other reversal signals. The pattern is significant because resistance levels represent price memory—areas where previous buyers were trapped and sellers successfully defended. When price returns to these levels, the same selling dynamics tend to repeat, creating reliable shorting opportunities. The pattern is most effective when combined with additional confluence factors such as overbought indicators, bearish divergence, or declining volume on the approach.
History & Etymology
Resistance rejection is among the oldest concepts in technical analysis, dating back to Charles Dow's work in the late 1800s. The idea that previous price highs create resistance to future advances is foundational to all chart analysis. Every school of technical analysis—Western, Japanese, Wyckoff, and modern smart money—recognizes the significance of resistance rejection.
'Resistance' refers to a price level that resists upward price movement. 'Rejection' describes the market's failure to accept prices above that level, with sellers pushing price back down.
How It Forms
Formation Steps
- 1Price approaches a well-established horizontal resistance level
- 2One or more candles show rejection at the level (long upper wicks, bearish closes)
- 3A confirmation candle closes decisively below the rejection candles
- 4Volume increases on the rejection and confirmation candles
Prerequisites
- A clearly defined horizontal resistance level with at least two prior touches
- Price approaching resistance from below in a rally
Confirmation Signals
- Bearish candlestick pattern at the resistance level (shooting star, engulfing, etc.)
- Volume spike on the rejection candle
- RSI overbought reading at the resistance level
Invalidation Signals
- Price closes above resistance with strong volume
- Multiple candles holding above the resistance level
- Bullish follow-through after touching resistance
Candle Breakdown
Approach Candle
A bullish candle that brings price close to or touching the resistance level, representing the final push of the rally.
Buyers are still confident, pushing price toward resistance. Volume may begin to decline as smart money steps aside.
Rejection Candle
A candle at the resistance level showing clear selling pressure—typically with a long upper wick and bearish or doji-like body.
Sellers aggressively defend the resistance level. The long upper wick shows that attempts to break through were firmly rejected.
Confirmation Candle
A bearish candle that closes below the rejection candle's low, confirming that the reversal is underway.
Buyers who entered near resistance panic as the rejection is confirmed. Their selling adds to the downward pressure.
Psychology
Resistance rejection exploits the 'pain point' concept—traders who previously bought at the resistance level and watched price decline are anxious to exit at breakeven. This selling pressure, combined with new short sellers, creates a self-reinforcing rejection zone.
Buyer Perspective
Buyers lose confidence as the resistance level holds once again. Those who bought near resistance are quickly underwater and forced to sell, adding to the reversal pressure.
Seller Perspective
Sellers wait patiently for price to reach resistance before entering short positions. The predictable rejection at known levels gives them a clear plan with well-defined risk.
Smart Money Action
Institutional sellers place large limit sell orders at resistance levels, creating a wall of supply that absorbs retail buying pressure.
Retail Trader Trap
Retail traders buy the breakout attempt at resistance, placing stop losses just below the level. The rejection triggers these stops, adding to the selling pressure.
Emotional Cycle
Trading Strategy
Aggressive Entry
Enter short when the rejection candle forms at resistance, placing the stop above the resistance level.
Conservative Entry
Wait for the confirmation candle to close below the rejection candle's low before entering short.
Previous swing low or the nearest support level
Midpoint of the prior rally range
Full measured move equal to the distance from resistance to the nearest support
Best Conditions
- Timeframe: 1D
- Timeframe: 4h
- Timeframe: 1h
- Range-bound markets
- Distribution phases
- After extended rallies
- Asset: Stocks
- Asset: Forex
- Asset: Indices
- Asset: Crypto
Avoid When
- Timeframe: 1m
- Strong trending markets with momentum
- Breakout environments
Confluence Factors
- Multiple timeframe resistance confluence
- RSI overbought (above 70)
- Bearish divergence on RSI or MACD
- Resistance aligns with a round number
- 200 SMA or EMA at the resistance level
- Fibonacci retracement level at resistance
Scale In Strategy
Enter initial position on the rejection, add on a retest of the resistance that fails again.
Scale Out Strategy
Take 50% at the first support level, trail the rest.
Risk Management
Volume Analysis
Volume Confirmation
The rejection candle should show volume 30%+ above average. Decreasing volume on the approach with a volume spike on rejection is ideal.
Volume Profile
Volume concentrated at the resistance level confirms active selling at that price.
Volume Divergence
Increasing volume on the approach but no breakout suggests strong supply at resistance.
Technical Confluence
Support Resistance
This pattern IS resistance analysis—the core of all technical analysis. The quality of the resistance level determines the quality of the signal.
Fibonacci Levels
Resistance at 38.2%, 50%, or 61.8% Fibonacci retracement levels adds significant confluence.
Moving Averages
Resistance at the 50 or 200 SMA/EMA adds dynamic resistance confluence to the horizontal level.
Rsi Confirmation
RSI above 70 at the resistance level with bearish divergence is a powerful confirmation.
Macd Confirmation
MACD histogram declining as price tests resistance suggests waning momentum.
Bollinger Bands
Price touching the upper Bollinger Band at resistance suggests overextension.
Vwap
Resistance at VWAP or above VWAP confirms sellers at premium levels.
Ichimoku Cloud
Resistance at the Kumo cloud boundary adds dynamic resistance confluence.
Elliott Wave
Resistance rejections often mark the end of corrective waves (Wave 2 or Wave B) in bearish impulses.
Wyckoff Phase
Resistance rejection within a trading range may signal an upthrust or UTAD in Wyckoff terms.
Market Profile
Resistance at the value area high (VAH) or point of control (POC) adds statistical significance.
Order Flow
Large resting sell orders visible in the order book at the resistance level confirm institutional selling interest.
Open Interest
Monitor open interest changes for additional confirmation of institutional participation in the move.
Multi-Timeframe Analysis
Higher Timeframe Alignment
A 4H resistance rejection at a daily or weekly resistance level is the highest probability configuration.
Lower Timeframe Entry
Use the 15M chart to find a precise entry within the rejection zone—look for a bearish engulfing or break of structure.
Timeframe Confluence
When resistance exists on the 1H, 4H, and daily charts at the same price level, the rejection is almost certain.
Top-Down Approach
Identify weekly/daily resistance > Wait for 4H approach > Enter on 1H or 15M rejection signal.
Statistics
Historical Examples
S&P 500 Resistance Rejection at 4,300
successThe S&P 500 rallied to the 4,300 resistance level that had held since August 2022. A shooting star formed at the level, and the index dropped 8% over the next month.
Lesson: Multi-month resistance levels on major indices provide high-reliability rejection setups.
GBP/USD Resistance Rejection at 1.2450
successGBP/USD tested the 1.2450 resistance level three times over two weeks, each time showing long upper wicks. The final rejection led to a 200-pip decline.
Lesson: Multiple rejections at the same level increase the probability of a significant reversal.
Variations
Multi-Test Rejection
Three or more tests of the same resistance level, with each test showing weaker buying pressure.
Gap-Up Rejection
Price gaps up to resistance and immediately reverses, closing below the opening gap.
Confusion Matrix
Patterns commonly confused with Bearish Resistance Rejection and how to distinguish them.
Bearish Double Top
7000% similarA resistance rejection is a single interaction with a resistance level. A double top involves two peaks at similar levels with a measurable pullback between them.
Key Differences
- Double top has two distinct peaks with a trough between them
- Resistance rejection can be a single test of a known level
- Double top is a formal chart pattern; resistance rejection is a price action concept
Bearish Shooting Star
6000% similarA shooting star is one candle type that may form during a resistance rejection. The resistance rejection concept encompasses the entire interaction with the level.
Key Differences
- A shooting star is a specific single-candle pattern
- Resistance rejection is a broader concept that may include multiple candles
- A shooting star can occur at any point; resistance rejection specifically occurs at a known level
The Double Top is an M-shaped reversal pattern where price tests a resistance level twice and fails, creating two peaks at similar levels. The breakdown below the neckline (trough between peaks) confirms the reversal with a measured move target equal to the pattern height.
The Bearish Engulfing is one of the most powerful and commonly traded two-candle reversal patterns. A large bearish candle completely engulfs the prior bullish candle, demonstrating a decisive shift from buying to selling dominance.
The gravestone doji is a single-candle reversal pattern with the open, close, and low at the same level and a long upper shadow, resembling a gravestone. It signals that buyers pushed price higher but sellers reclaimed all gains by the close.
A bearish order block is the last bullish candle before a significant bearish displacement, representing an area where institutional sellers placed large sell orders. When price returns to this zone, it often reverses downward as unfilled orders are executed.
The shooting star is a single-candle bearish reversal pattern with a small body near the low and a long upper shadow. It shows that buyers pushed price significantly higher during the session but sellers drove it back down, signaling a potential top.
The Bullish Support Bounce is one of the most fundamental trading patterns where price declines to a well-established support level and bounces higher, confirmed by bullish price action and volume at the support zone.
Pro Tips & Common Mistakes
Pro Tips
- The more times a resistance level has been tested, the more significant a rejection at that level becomes.
- Wait for the rejection candle to close before entering—wicks can extend before the session ends.
- Combine resistance rejection with a higher-timeframe bearish trend for the highest probability setups.
- Round numbers (e.g., $100, $1.2000) act as psychological resistance and enhance rejection signals.
- Use the strength of the rejection candle to gauge the likely size of the reversal—bigger wicks suggest stronger selling.
Common Mistakes
- Shorting at resistance in strong uptrends—momentum can easily break through
- Not defining the resistance level precisely—use closing prices, not just wicks
- Entering before the rejection is confirmed—wait for the close
- Setting stop losses too tight, directly at the resistance level
- Ignoring volume—low-volume rejections are less reliable
Advanced Techniques
- Use market profile to identify high-volume nodes at resistance—these are the most reliable rejection levels.
- Combine resistance rejection with options data: high call open interest at resistance creates a 'gamma wall' that reinforces the rejection.
- Track the order book for large resting sell orders at the resistance level—these confirm institutional selling interest.
- Use time analysis: resistance rejections that occur during high-volume sessions (London-NY overlap) are more reliable than those during thin sessions.
Institutional Perspective
Institutions place large sell limit orders at resistance levels, creating concentrated supply zones. The visibility of these orders in the order book provides a roadmap for price behavior. When retail buying is absorbed by institutional selling, the rejection occurs naturally.
Fun Facts
- The concept of resistance rejection is so fundamental that it appears in virtually every trading education resource ever written.
- Some estimates suggest that horizontal resistance levels have a 55-65% chance of holding on any given test.
- The most famous resistance rejection in stock market history was the Dow's repeated failure to break above 1,000 between 1966 and 1982—a 16-year resistance level.
Frequently Asked Questions
A resistance level is significant when it has at least two prior touches, aligns with multiple timeframes, corresponds to a round number, and shows volume confirmation. The more confluence factors, the stronger the resistance.
Wait for price to reach a known resistance level, look for a bearish rejection candle (shooting star, engulfing, etc.), then enter short with a stop loss above the resistance level and a target at the nearest support.
Resistance rejections fail when the broader trend has strong momentum, when volume supports a breakout, or when a fundamental catalyst drives price through the level. Always use a stop loss above resistance.